72 tidyr package
Written by Mariam Walaa and last updated on 7 October 2021.
72.1 Introduction
In this lesson, you will learn how to:
- Use additional
tidyrfunctions, such asunnest_wider()andunnest_longer()
Prerequisite skills include:
- Previous tutorials involving
tidyrfunctions
Highlights:
- We can use
tidyrfunctions to put a non-tidy dataset into tidy format. - unnest_wider() and unnest_longer() give flexibility in terms of how to unnest data.
72.2 Overview
A common theme across working with datasets is standardizing the dataset format. Datasets must be standardized. If every dataset was unique in its format, it would be difficult for data scientists and data analysts to work on them. Everyone would have a vastly different workflow needed to reach the analysis step, and people would have a harder time collaborating with each other and evaluating each other’s results. That is why datasets must be standardized.
You may wonder how we can standardize a dataset when we have one, and to what extent we can standardize it. In Hadley Wickham’s Tidy Data paper from 2014, Hadley introduces 3 rules every dataset must follow in order to be considered tidy: Every row must be an observation, every column must be a variable, and every cell is a single measurement. Here is an illustration that summarizes these 3 rules, by Allison Horst.
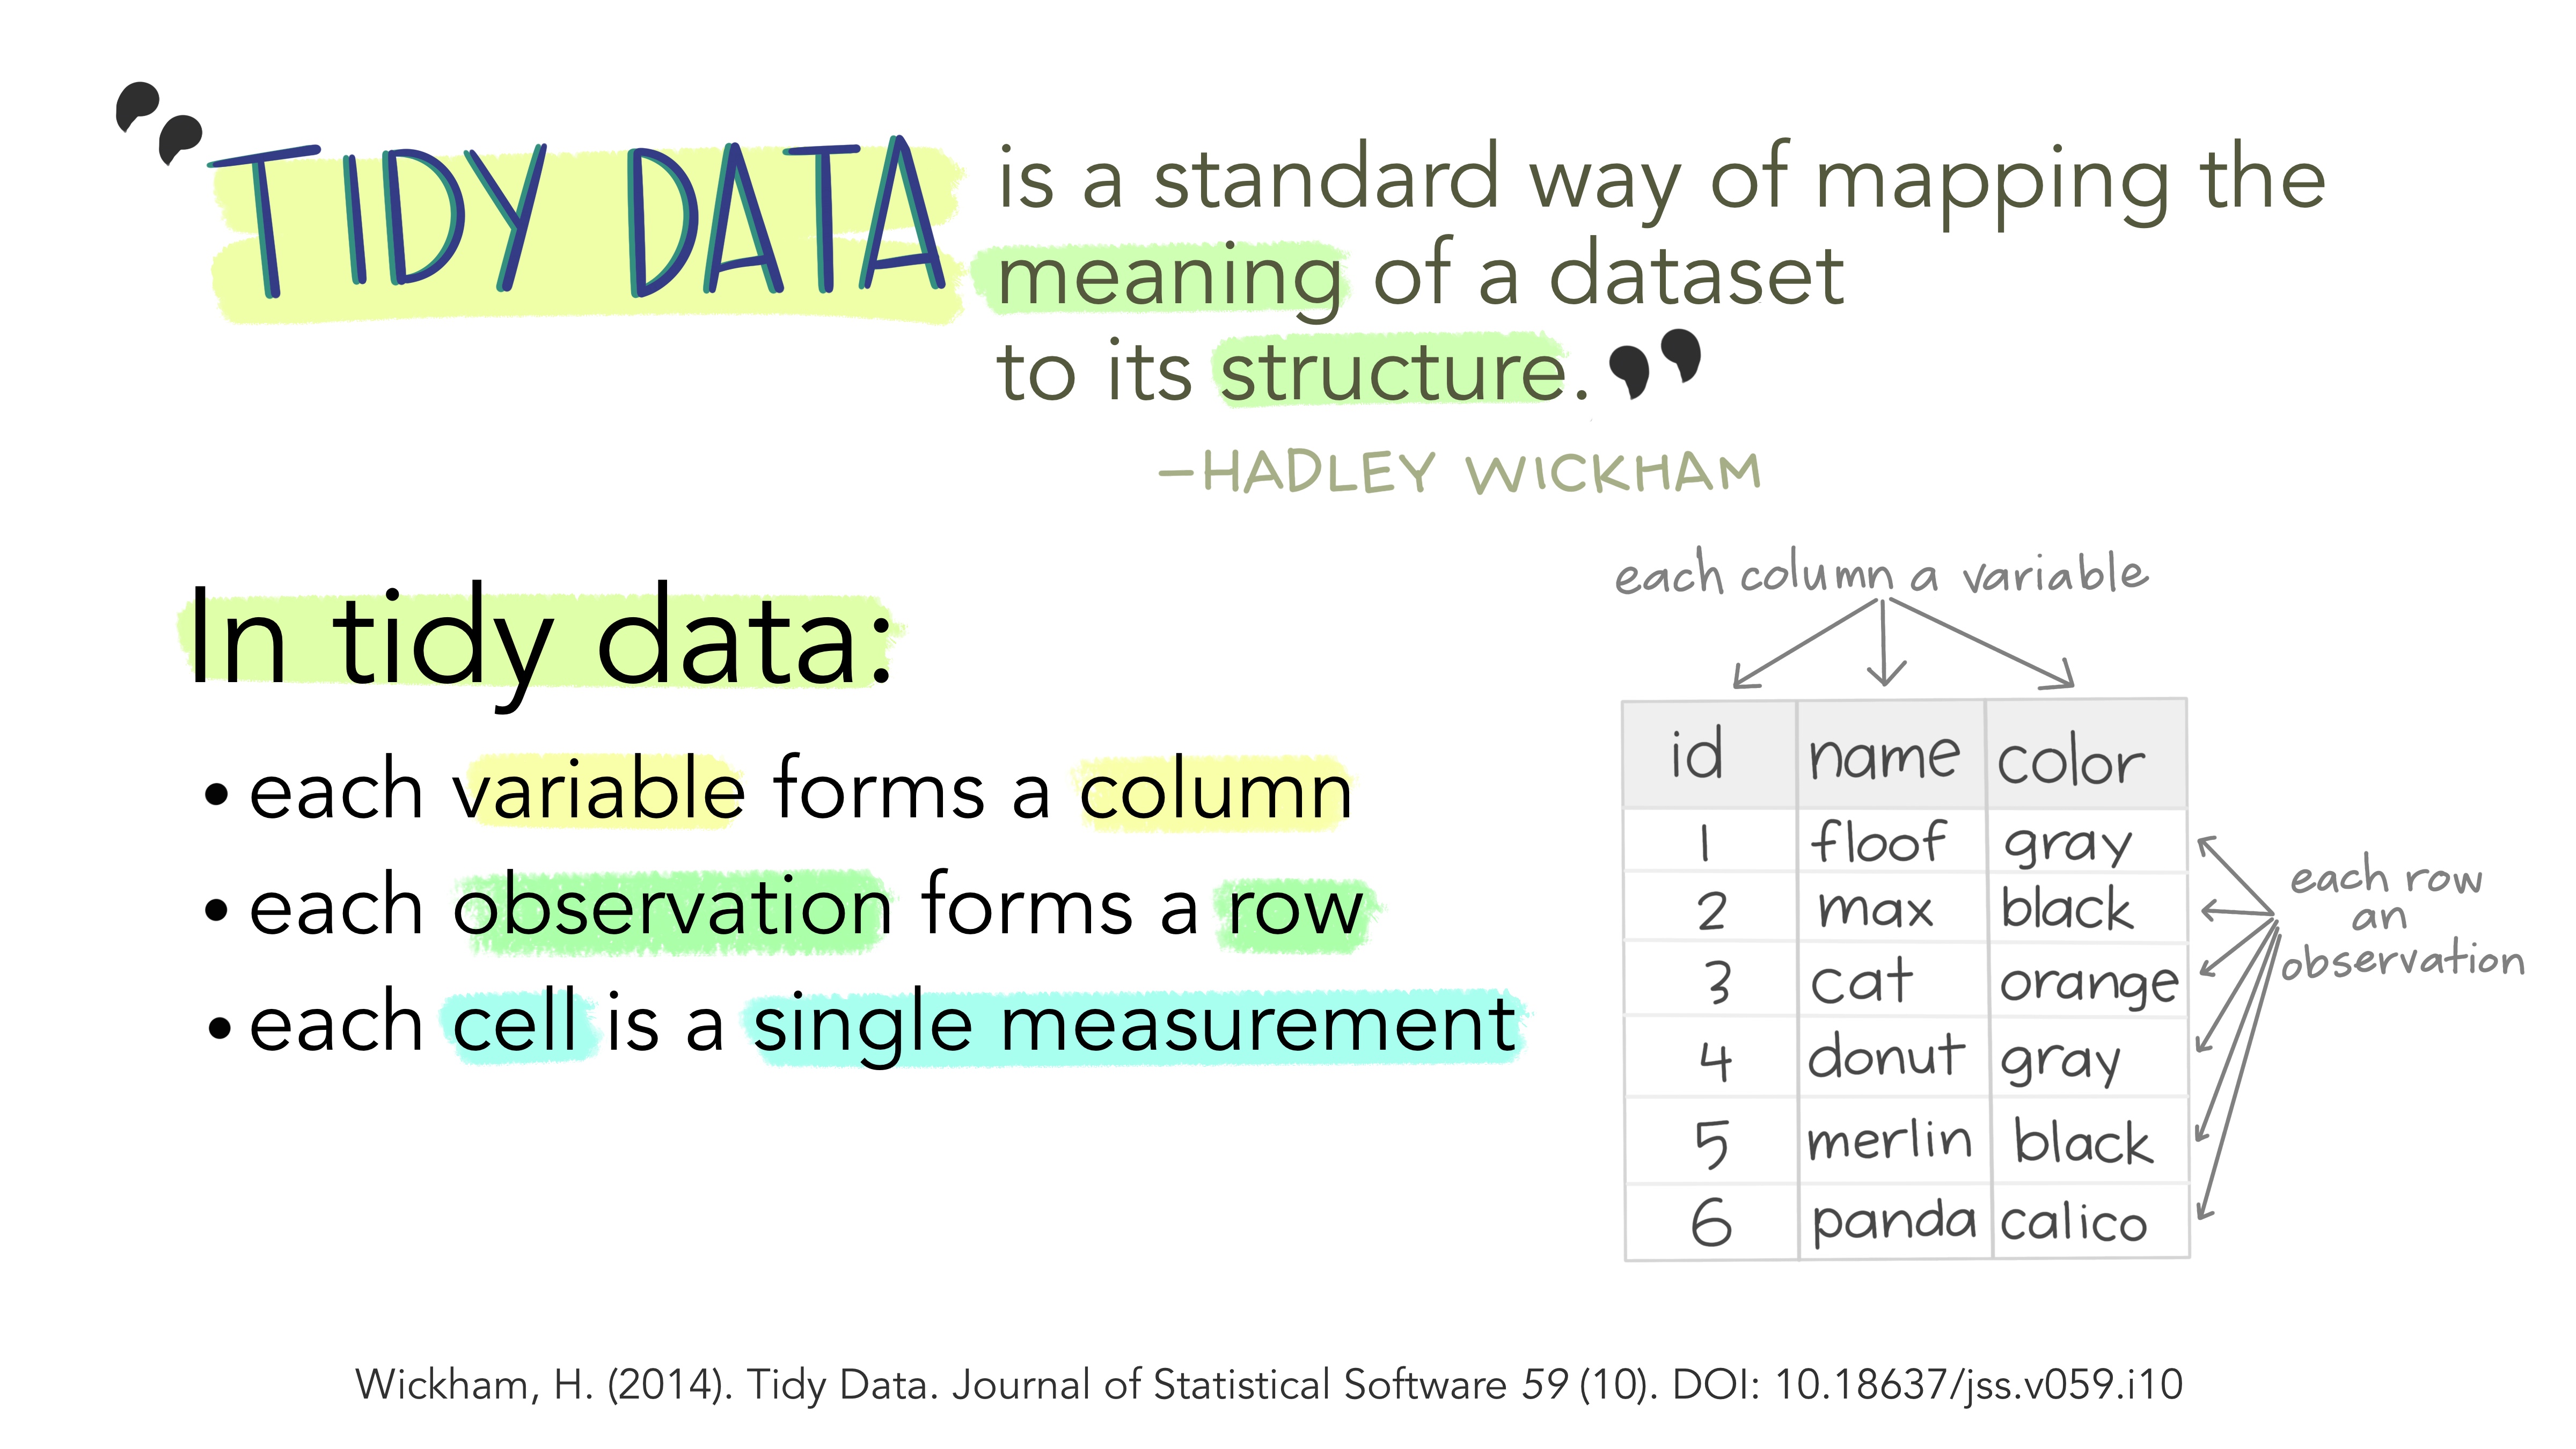
Credits: Allison Horst
As the title says, this section will provide you with a summary of some functions you have seen in previous tutorials, as well as introduce you to more functions from tidyr that you have not seen yet.
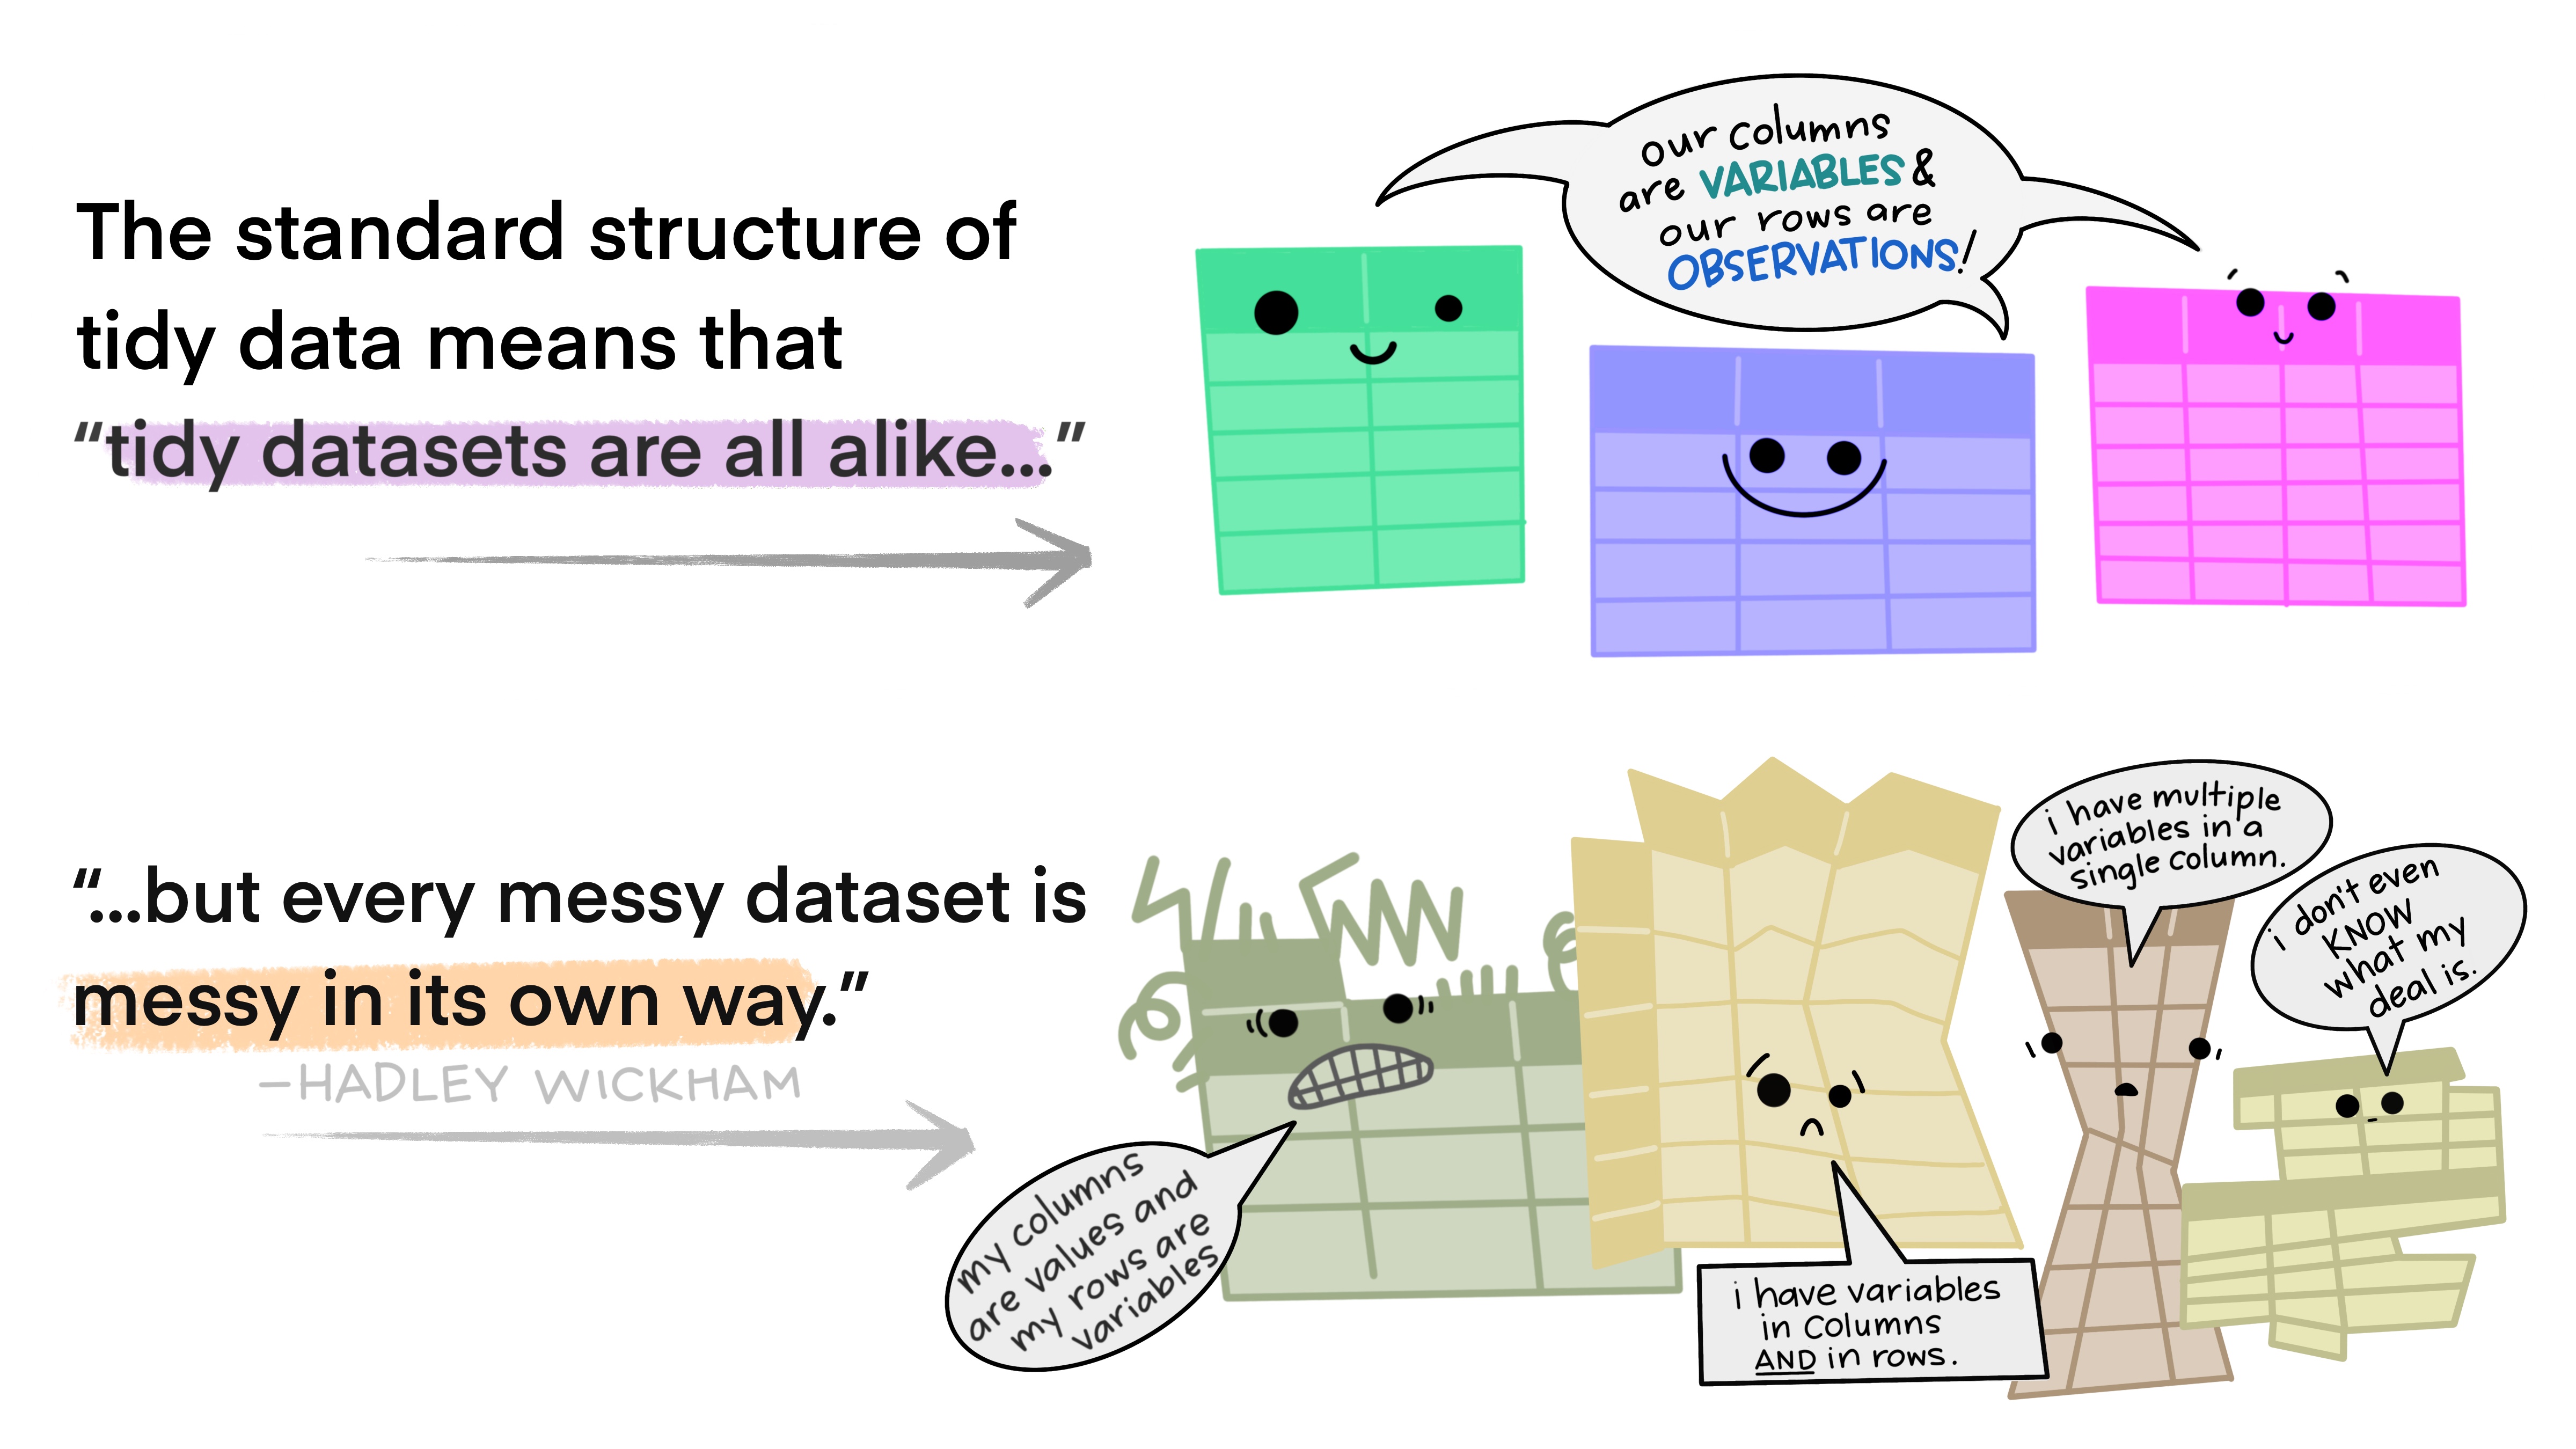
Credits: Allison Horst
72.3 Example
Suppose you are given this data that is not in tidy format.
nontidy_data
#> # A tibble: 3 × 4
#>   variable  `1`       `2`       `3`
#>   <chr>     <list>    <list>    <list>
#> 1 n_lines   <dbl [1]> <dbl [1]> <dbl [1]>
#> 2 n_figures <dbl [1]> <dbl [1]> <dbl [1]>
#> 3 n_scripts <dbl [1]> <dbl [1]> <dbl [1]>
First, the columns and rows are switched, and second, the cells are all hidden.
Here is the code we need to tidy it:
nontidy_data %>%
  pivot_longer(cols = -variable, names_to = "name", values_to = "value") %>%
  pivot_wider(names_from = "variable") %>%
  unnest(everything())
#> # A tibble: 3 × 4
#>   name  n_lines n_figures n_scripts
#>   <chr>   <dbl>     <dbl>     <dbl>
#> 1 1         100         4        10
#> 2 2         200         5        20
#> 3 3         300         6        30
Lets go through this step by step and check the output each time.
To clean it, we will use our functions pivot_longer(), pivot_wider(), and unnest() from tidyr.
# 1. Convert to long format
nontidy_data_l <- nontidy_data %>%
  pivot_longer(cols = -variable, names_to = 'name', values_to = 'value')
nontidy_data_l
#> # A tibble: 9 × 3
#>   variable  name  value
#>   <chr>     <chr> <list>
#> 1 n_lines   1     <dbl [1]>
#> 2 n_lines   2     <dbl [1]>
#> 3 n_lines   3     <dbl [1]>
#> 4 n_figures 1     <dbl [1]>
#> 5 n_figures 2     <dbl [1]>
#> 6 n_figures 3     <dbl [1]>
#> 7 n_scripts 1     <dbl [1]>
#> 8 n_scripts 2     <dbl [1]>
#> 9 n_scripts 3     <dbl [1]>
Our dataset is in a long format now.
# 2. Convert to wide format
nontidy_data_w <- nontidy_data_l %>%
  pivot_wider(names_from = 'variable')
nontidy_data_w
#> # A tibble: 3 × 4
#>   name  n_lines   n_figures n_scripts
#>   <chr> <list>    <list>    <list>
#> 1 1     <dbl [1]> <dbl [1]> <dbl [1]>
#> 2 2     <dbl [1]> <dbl [1]> <dbl [1]>
#> 3 3     <dbl [1]> <dbl [1]> <dbl [1]>
Notice how step 2 brings the variable names to the top.
# 3. Unnest (or unfold) the cells
tidy_data <- nontidy_data_w %>%
  unnest(everything())
tidy_data
#> # A tibble: 3 × 4
#>   name  n_lines n_figures n_scripts
#>   <chr>   <dbl>     <dbl>     <dbl>
#> 1 1         100         4        10
#> 2 2         200         5        20
#> 3 3         300         6        30
Now it is tidy data. You can also clean it up as follows:
tidy_data %>%
  column_to_rownames('name')
#>   n_lines n_figures n_scripts
#> 1     100         4        10
#> 2     200         5        20
#> 3     300         6        30
72.4 Exercises
We will be looking at a data set of Broadway shows with variables about the performances, attendance, and revenue for theaters that are part of The Broadway League. You can learn more about the data set provided by Alex Cookson in this Git repository as well as this corresponding blog post. Take a look at a subset of this data for the Winter Garden Theatre.
# winter_gardenYou can Click Next to look through the observations.