91 Multiple plots with patchwork
Written by Michael Chong and last updated on 7 October 2021.
91.1 Introduction
In this lesson, you will learn how to:
- use the
patchworkR package to make multi-panel plots
Prerequisite skills include:
- familiarity with
ggplot()
91.2 What is patchwork?
In some situations it might be useful to arrange multiple plots side by side. The patchwork R package provides a really easy way to do this.
The package website is a great resource on its own. Most of the content in this lesson can also be found there.
To get started, make sure to have the package installed, which you can get using the default install command:
install.packages("patchwork")and load the package:
91.3 Getting started
First, make some plots that you want to put together. Here’s an example using the palmerpenguins dataset.
library(palmerpenguins)

# Make a scatterplot of flipper length vs. body mass
first_plot <- ggplot(penguins, aes(x = flipper_length_mm, y = body_mass_g)) +
  geom_point()

# Make a boxplot of body mass by sex
second_plot <- ggplot(penguins, aes(x = sex, y = body_mass_g)) +
  geom_boxplot()
Putting two plots together is as simple as just “adding” them with a + sign:
# Add them together side by side
first_plot + second_plot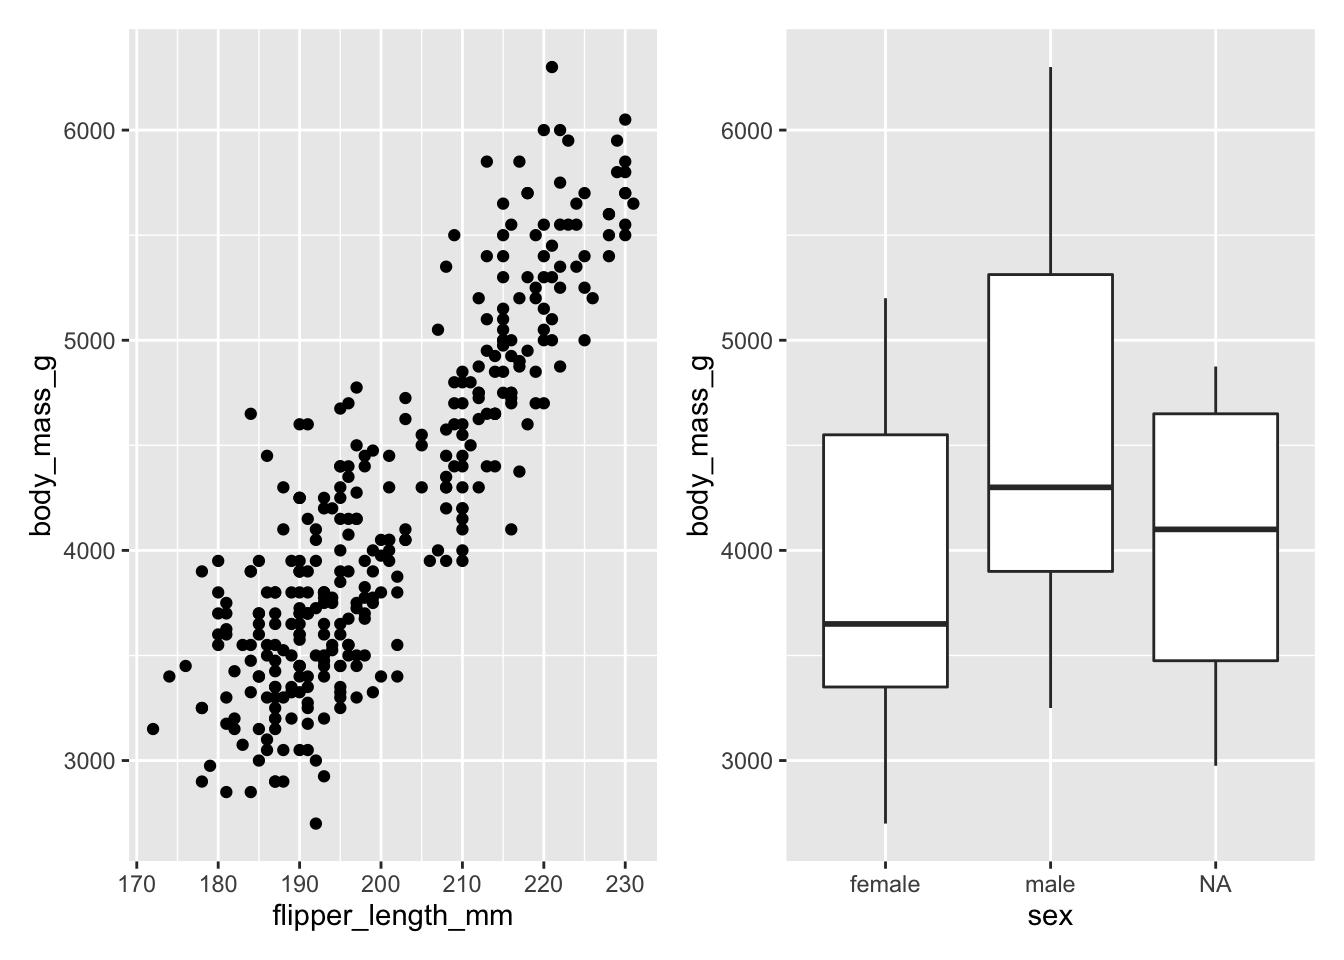
If we want to stack the plots on top of each other, we use the / symbol instead:
# Stack them on top
first_plot / second_plot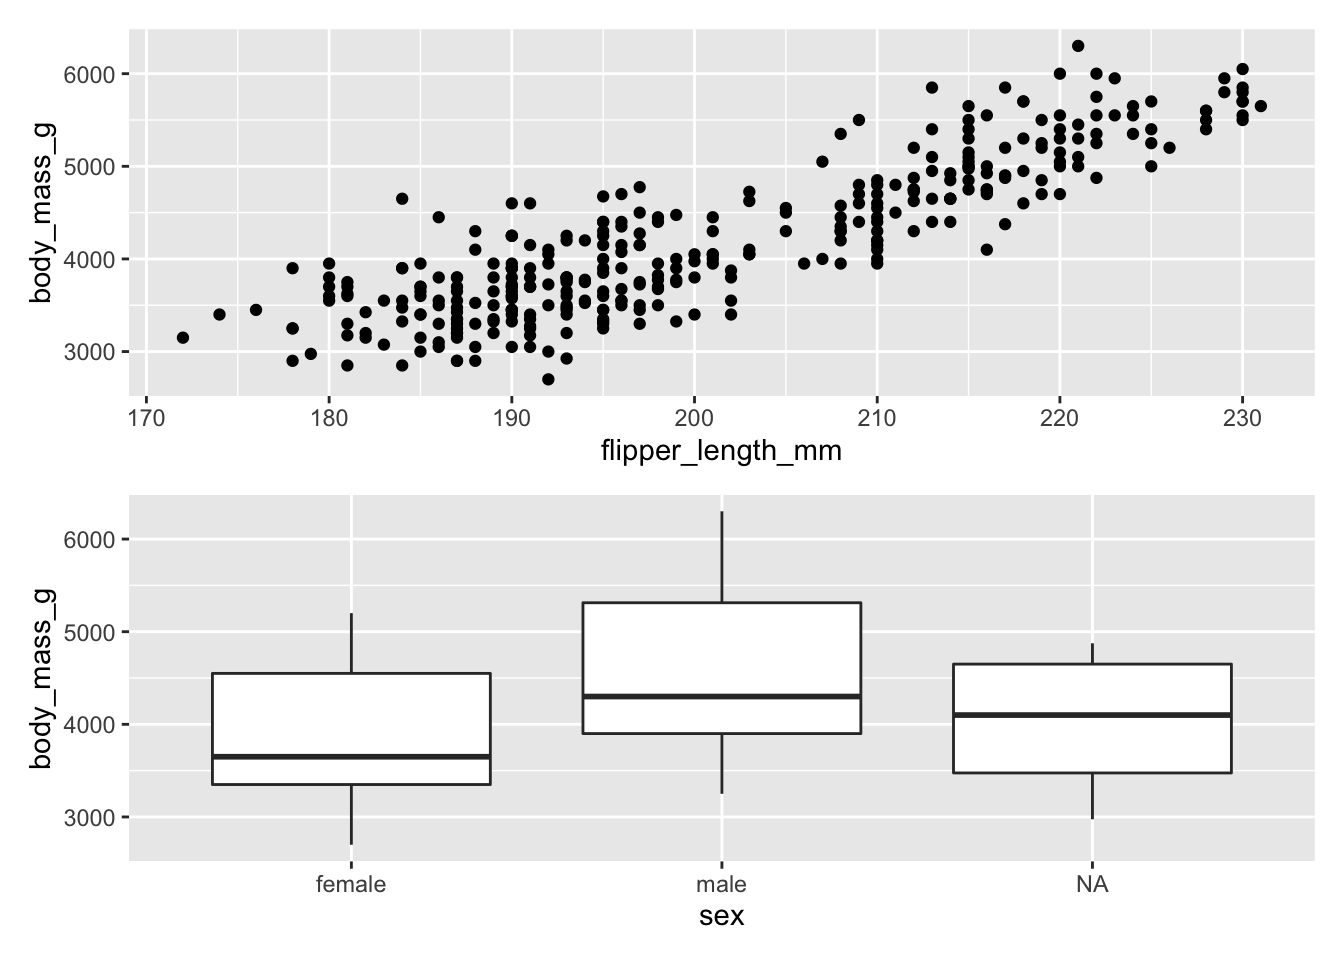
It’s that simple!
91.4 More complicated layouts
Okay, what if you have more than 2 plots that you want to arrange? Suppose we also want to plot how size varies by island.
third_plot <- ggplot(penguins, aes(x = island, y = body_mass_g)) +
  geom_boxplot()
To put them in a row, I’d recommend using | (instead of +, which doesn’t always force them in a row)
first_plot | second_plot | third_plot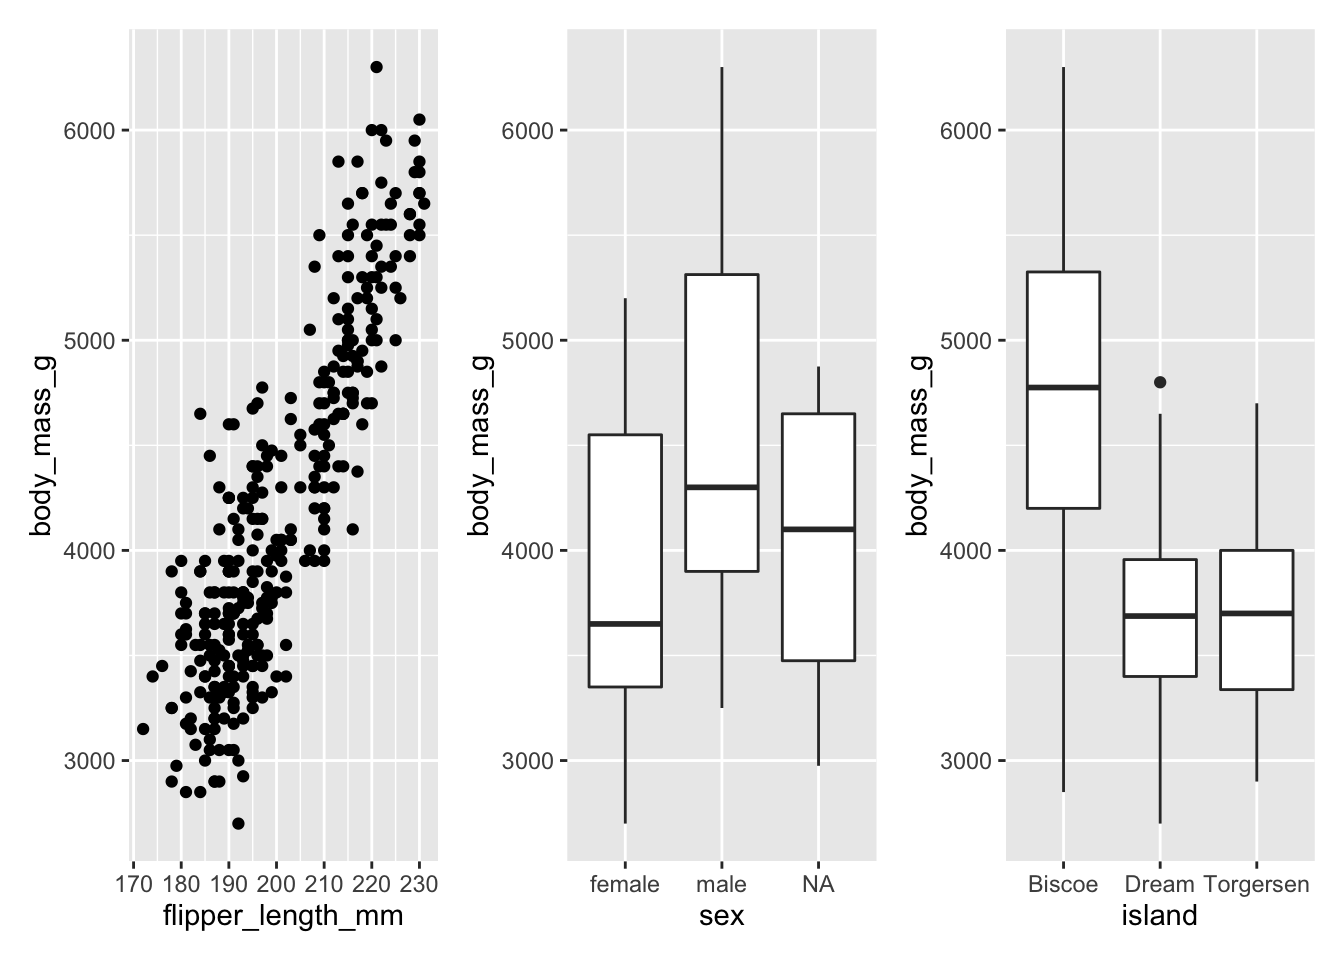
or, you can stack as many as you want by adding more / symbols:
first_plot / second_plot / third_plot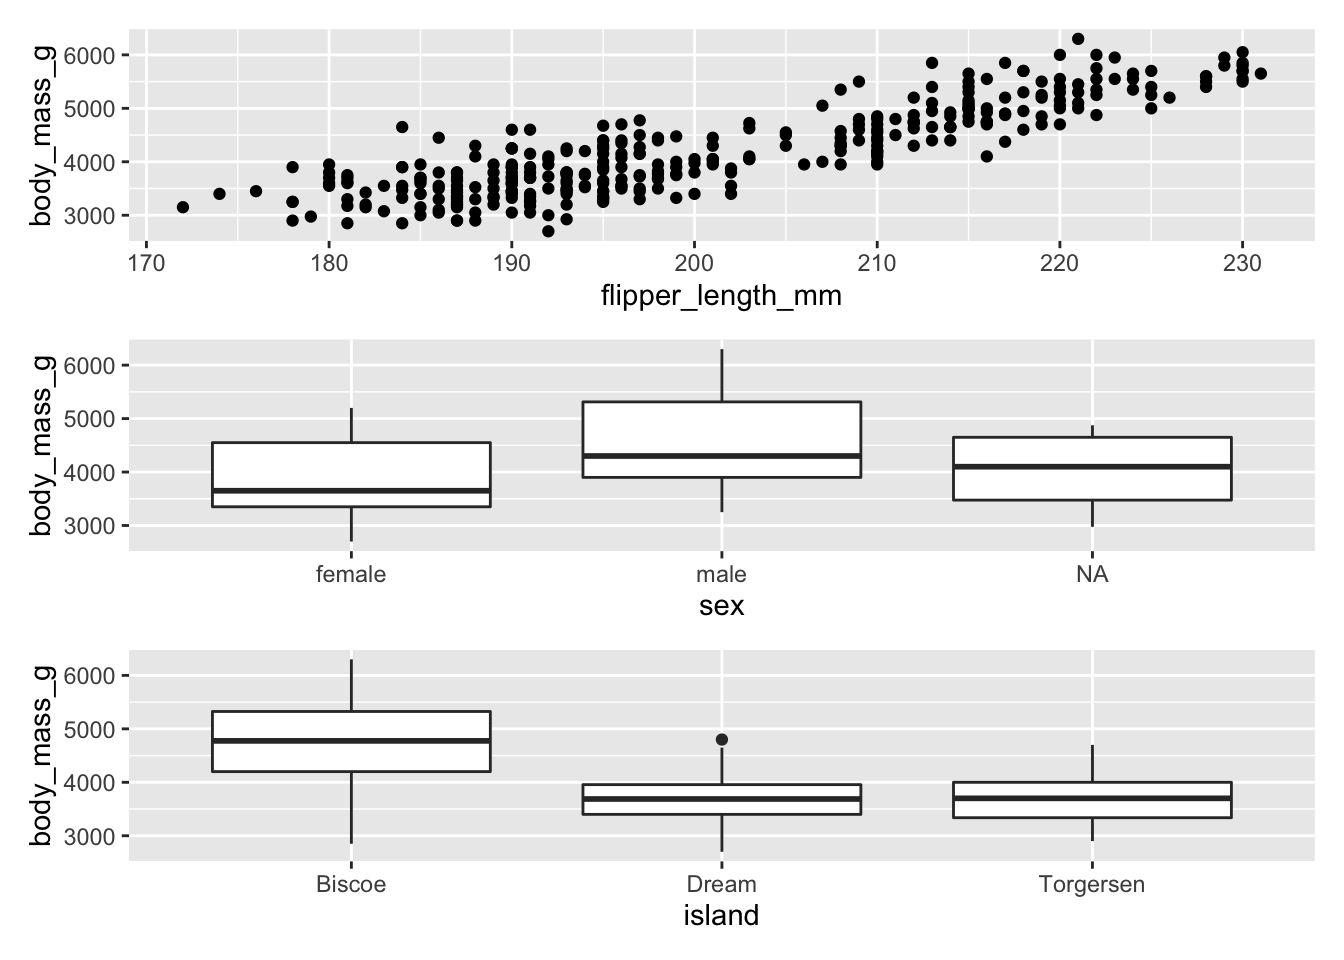
Or, you can arrange them using a mix of | and /:
first_plot | second_plot / third_plot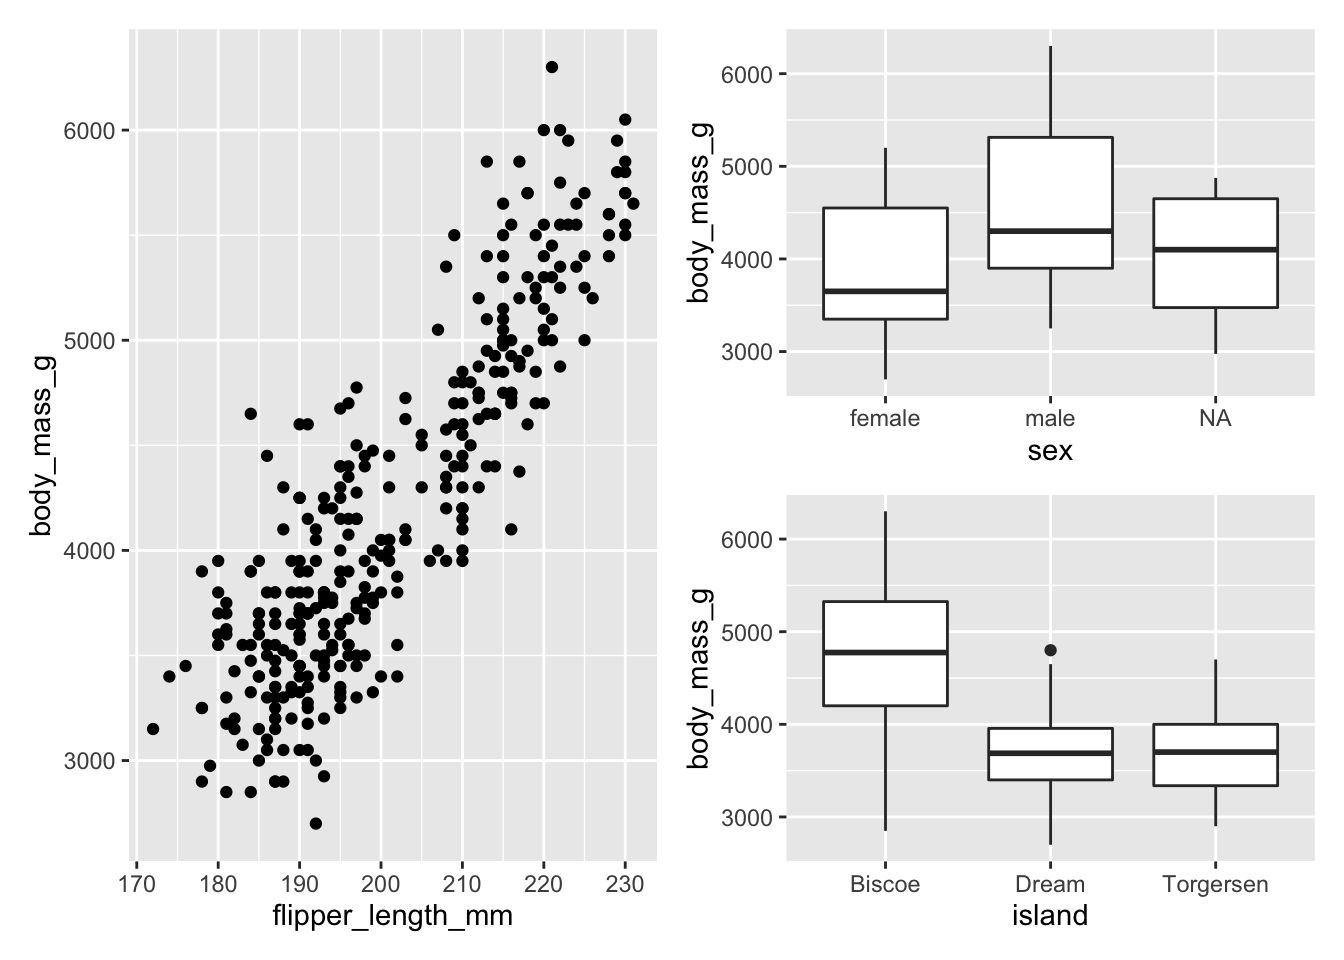
You can use parentheses ( ) to change “the order of operations” to change how things are arranged:
(first_plot | second_plot) / third_plot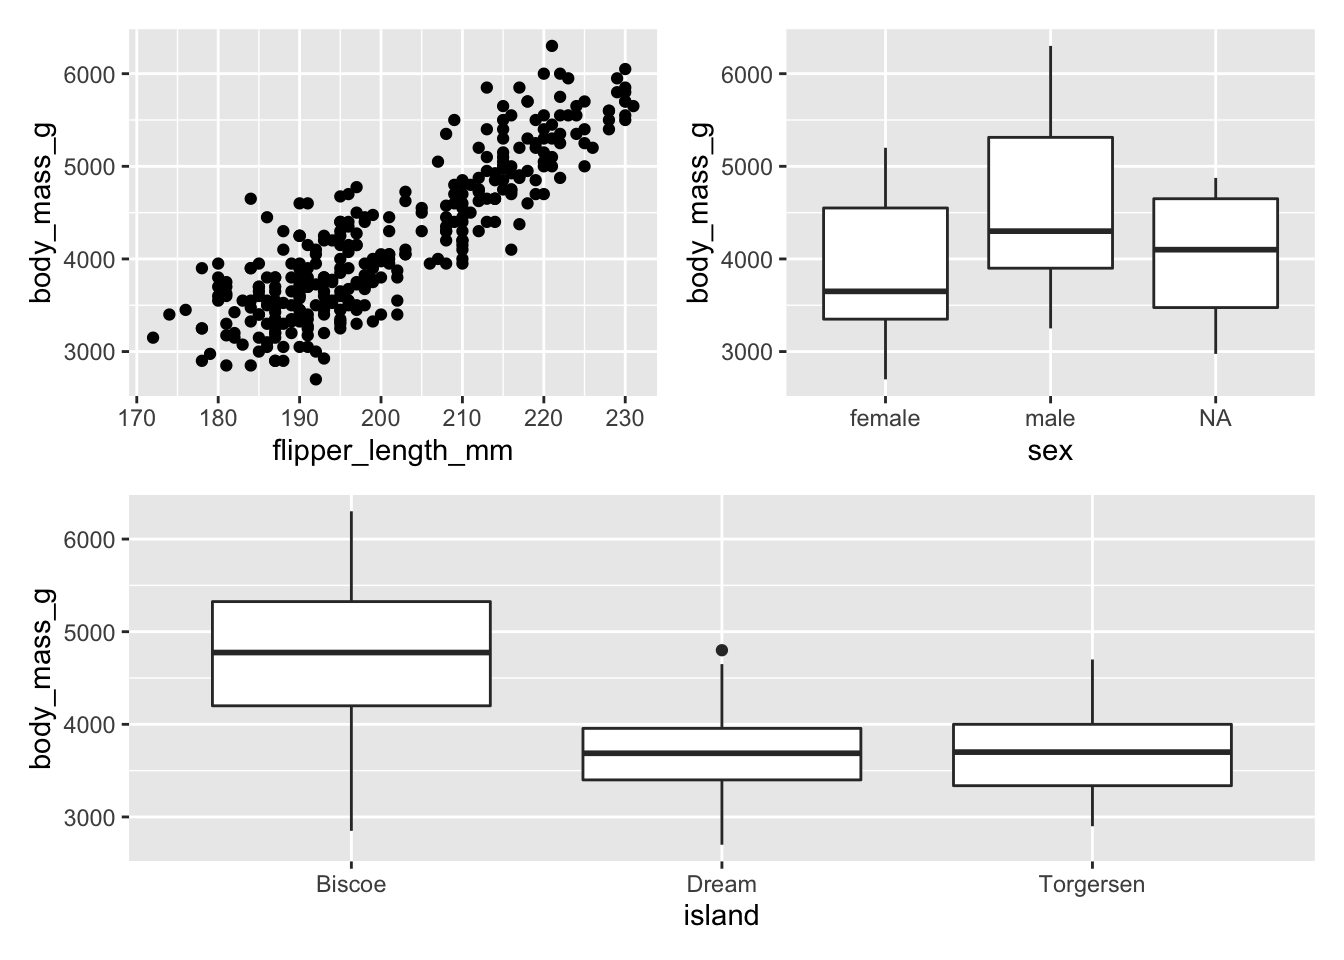
With these few tools, you can get good looking multi-panel plots relatively easily!
91.5 Customization and annotation
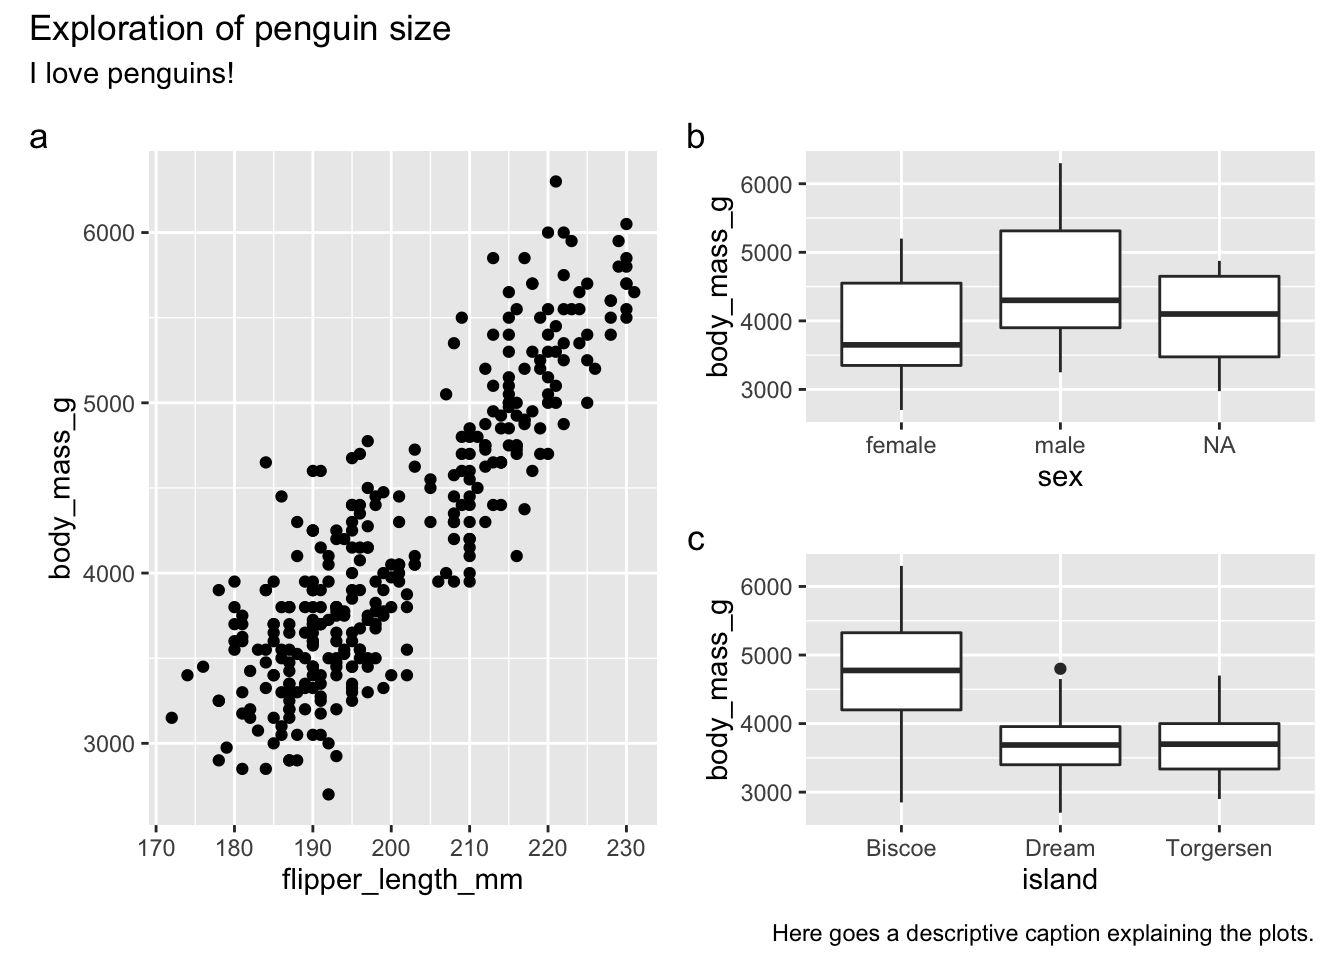
After you have the plots arranged in the way you want, maybe you want to add a title and labels, which you can do using the plot_annotation() function. You can just add this to the patchwork expression.
As an example, I’ll add a title, subtitle, caption, as well as “tag” the individual subplots with “a,” “b,” “c.”
(first_plot | second_plot / third_plot) +
  plot_annotation(
    title = "Exploration of penguin size",
    subtitle = "I love penguins!",
    caption = "Here goes a descriptive caption explaining the plots.",
    tag_levels = "a"
  )
Note that I have to wrap first_plot | second_plot / third_plot in parentheses ( ) – otherwise the annotations won’t be added correctly. You can also assign the patchwork as its own object before adding the annotations:
my_patchwork <- first_plot | second_plot / third_plotThe arguments for title, subtitle, and caption are straightforward – you just provide a string of text to display.
For tag_levels, you specify how you want the subplots to be labelled. You can provide:
-
afor lowercase letters (shown above), -
Afor uppercase letters, -
1for numbers, -
iorIfor lowercase or uppercase Roman numerals
Remember you can always check how to use the function using ?plot_annotation.
91.6 Exercises
91.6.1 Exercise 1
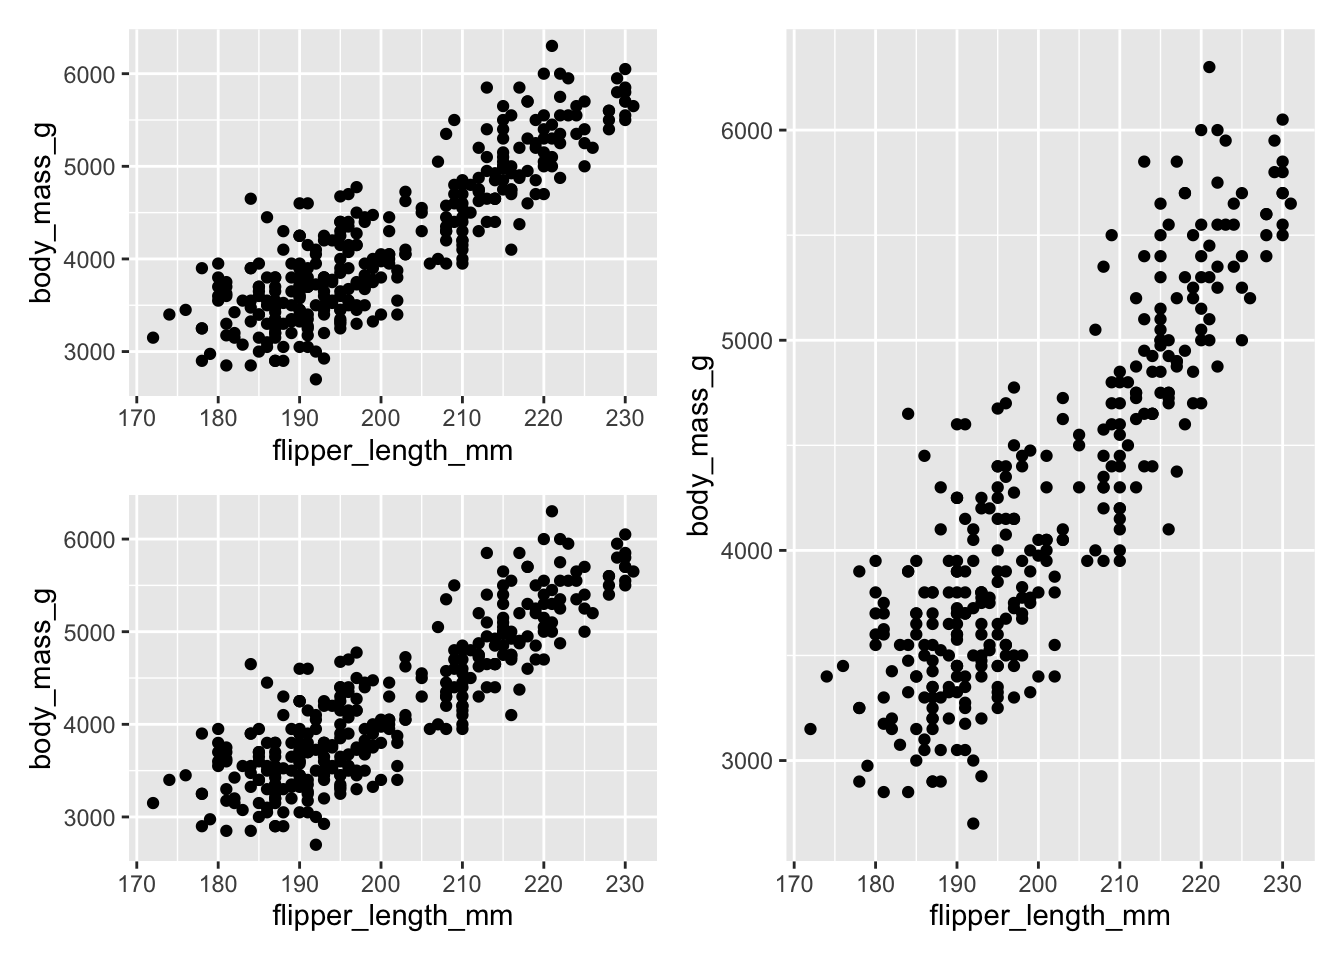
Using the plot first_plot three times, recreate the patchwork layout above.
(first_plot / first_plot) | first_plot
91.6.2 Exercise 2
Annotate the plot you made in Exercise 1! Replicate the following:
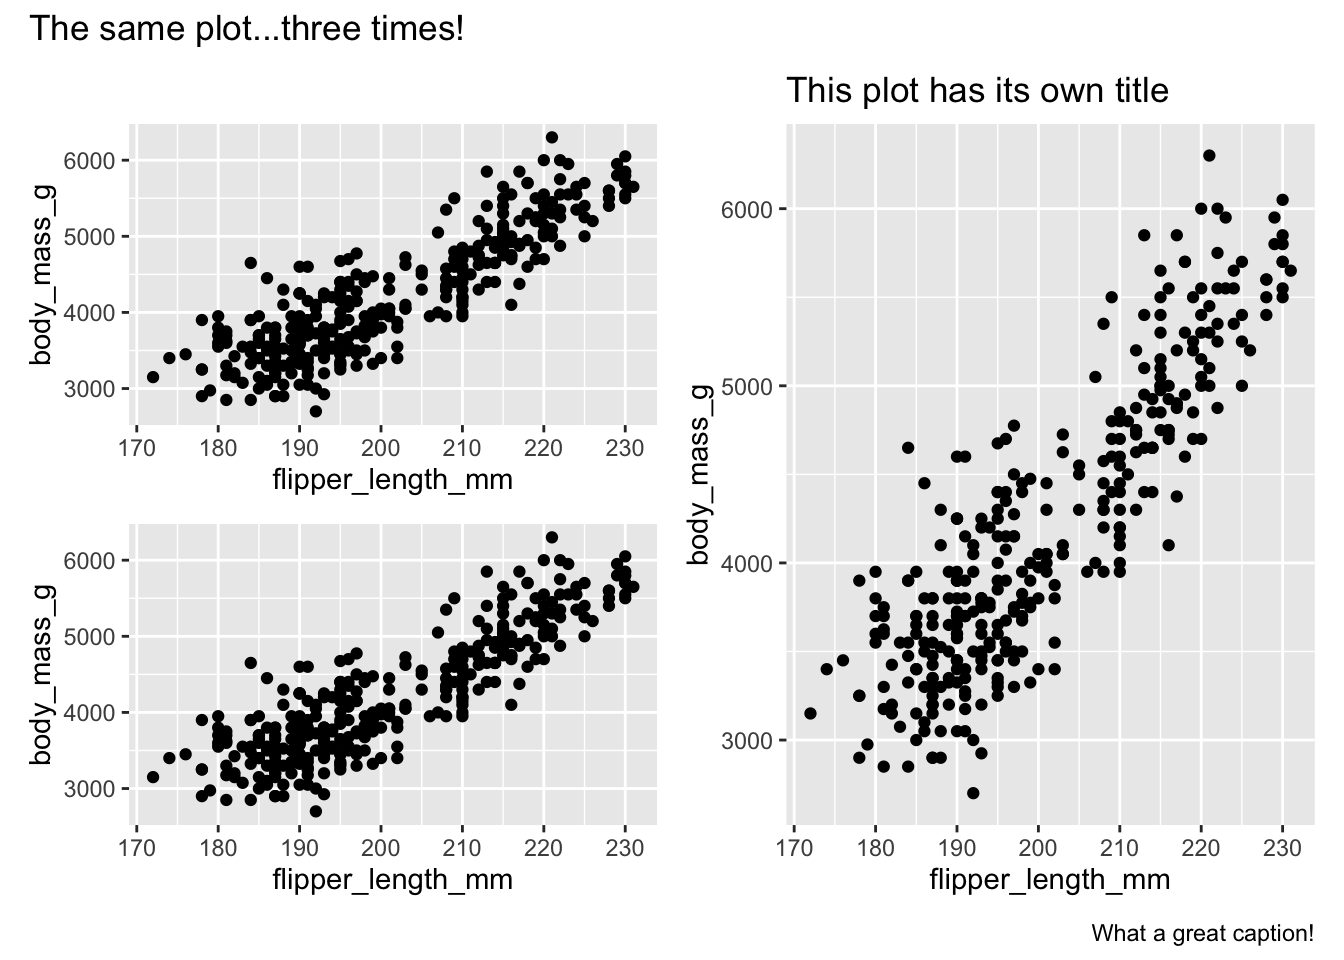
You'll need to modify one of the subplots.
first_plot_modified <- first_plot + labs(title = "This plot has its own title")

((first_plot / first_plot) | first_plot_modified) +
  plot_annotation(
    title = "The same plot...three times!",
    caption = "What a great caption!"
  )
91.7 Common Mistakes & Errors
Annotations aren’t showing up You might need to make sure you’re adding the plot_annotation() to the patchwork object. Try wrapping your patchwork in parentheses (e.g. (plot1 | plot2) + plot_annotation(...)), or saving it to a different object first (patchwork <- plot1 | plot2; patchwork + plot_annotation(...))
I’m having trouble laying out my plots how I want Check out some of the resources under Next Steps – in particular browsing the patchwork website. This lesson just introduces some of the basic functionality, and there’s lots more to know!
Error: Can't add ____ to a ggplot object First, make sure you’ve loaded the patchwork package with library(patchwork). Then, make sure that all the plots you’re trying to add together are ggplot objects (see code chunk below).
class(first_plot)
#> [1] "gg"     "ggplot"
patchwork and plot() Note that plots made using base R’s plot() function aren’t compatible with patchwork (as far as I know)! If you need to put base R plots together in a similar way, you can try using the cowplot R package.
91.8 Next Steps
If you need more functionality, the patchwork package is capable of much more! You can browse the main website or check out these vignettes:
If you still need more functionality to get those plots perfectly arranged, you can try the cowplot package. It’s more powerful, but the syntax is a bit more difficult.