83 Exercise 1
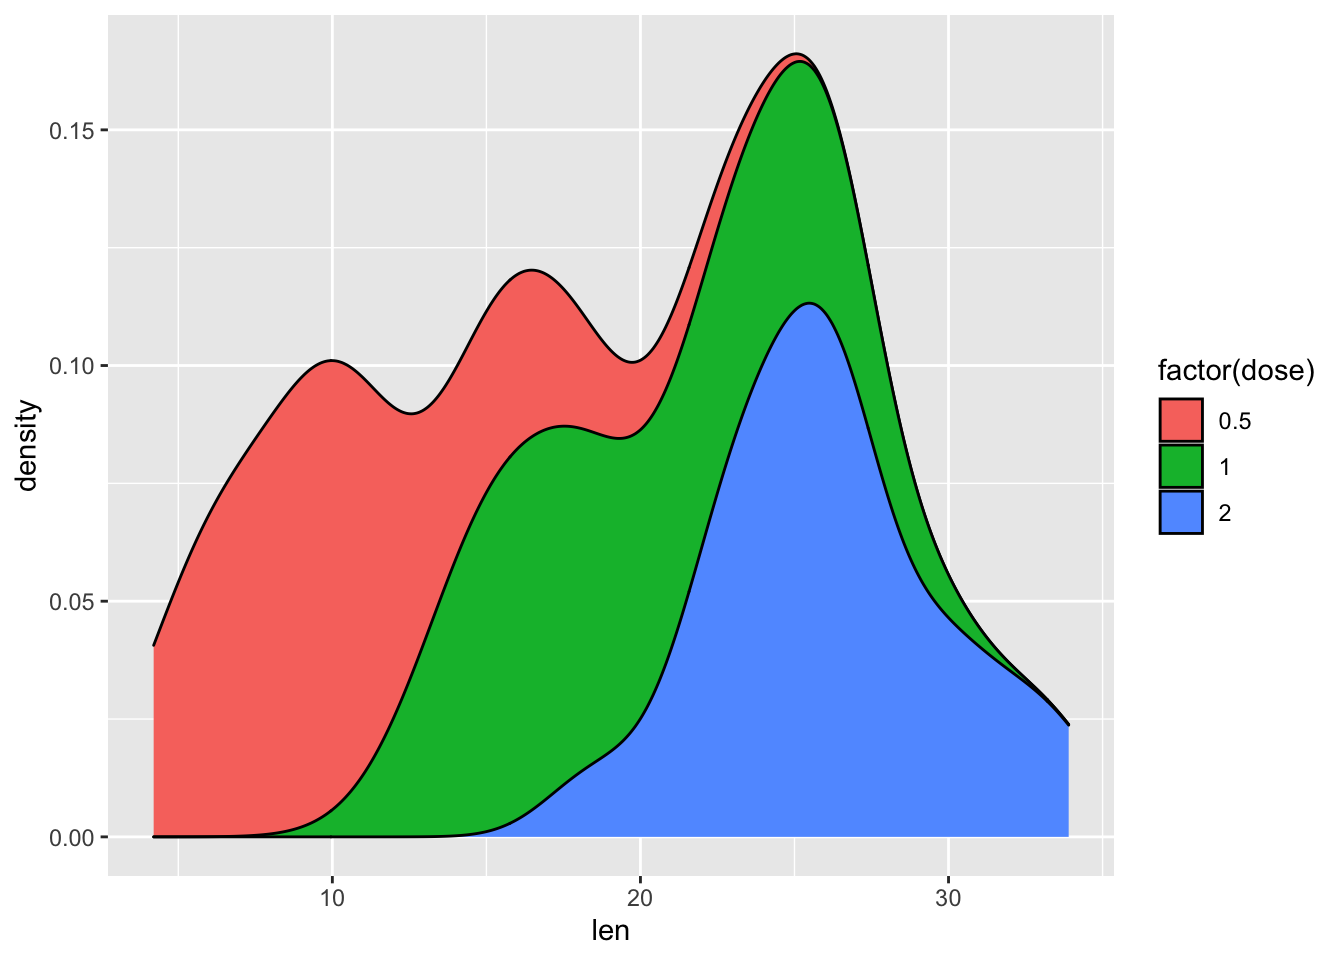
Create a stacked Density plot using the ToothGrowth data set to observe the varying distribution of tooth lengths according to the dose supplied(as a factor). You would want to use the len variable as an aesthetic and fill with factor(dose). Make sure the plot is stacked by specifying position=stack in the geom_density layer.
ggplot(ToothGrowth, aes(len, fill = factor(dose))) +
  geom_density(position = "stack")