27 What is the tidyverse?
Written by Yena Joo and last updated on 7 October 2021.
27.1 Introduction
In this lesson, you will learn:
- What the
tidyverseis, and what core packages there are.
- That with the tools provided by packages in the
tidyverse, you can save up your time, and focus more on your interpretations and analysis.
In order to analyze or visualize data, you will need a clean, tidy set of data to work with, and sometimes the downloaded data could be too unorganized or contain too much information that is unnecessary. In order to tidy up the data, you would need this tidyverse package. Once you have tidy data, you would want to visualize them, or create a table, or iterate through your data. Tidyverse is a collection of R packages designed for data science, that can do everything I just mentioned above.
Prerequisite skills include:
- How to install packages!
You will need to install a package called tidyverse.
dplyr, ggplot, tidyr, readr, tibble, and many other packages are part of tidyverse which helps you visualize and manipulate the tidy data. In the following lectures, you will get to learn essential functions often used in the package tidyverse.
Highlights:
- Tidyverse!
27.2 Core tidyverse packages
Various packages inside a tidyverse package do not need to be installed individually, you can install them at once by executing install.packages("tidyverse"). However, when you run library(tidyverse), only a several packages are going to be installed, which is called a ‘core tidyverse.’ Core tidyverse in tidyverse includes: ggplot2, dplyr, tidyr, readr, purrr, tibble, stringr, and forcats.
27.2.1 readr
The readr package is used to import data sets such as csv, tsv files. It is designed to parse different types of data you can find online, and turn it in to a clean format so you can use in R. For example, you can use the readr package to import csv files as follows:
df <- read_csv("any csv file.csv")There are other functions such as:
-
read_tsv(): for tab separated files
-
read_delim(): for general delimited files
-
read_log(): for web log files, and more.
Typing vignette("readr") into the console will provide you a detailed information of the package, such as how readr reads the column types, and tips on how to solve parsing problems.
Also, here is an additional resource you may find helpful.
27.2.2 tibble
A tibble is a form of a data frame. The package tibble lets you know about the information of the data set you imported. You can confront problems using the package earlier, so you don’t run into a problem while you visualize or manipulate your dataset.
For example, you can create a tibble from scratch using the function tibble() with individual vectors as follows:
tibble(
  a = c(1, 2, 3),
  b = c(10, 11, 12)
)
#> # A tibble: 3 × 2
#>       a     b
#>   <dbl> <dbl>
#> 1     1    10
#> 2     2    11
#> 3     3    12
As you can see, tibble() does not change the input types or the name of the variables. You can also create tibbles with the function data_frame()(and this is different from data.frame()!).
To convert an existing data frame into a tibble, you can use the function as_tibble(). If you want to convert a tibble back to an original data frame, you can use as.data.frame() function to do so. In some cases, it may be more convenient to input in row units. In this case, you can use the function tribble().
Also, note that tibbles will only show the first 10 rows, and only the columns that fit on screen. This feature of the tibble makes easier to check the characteristics of the data on display than using the original data frame.
If you would like to learn more about tibble, here is an additional resource you may find helpful.
27.2.3 tidyr
The tidyr package is used to create tidy data. Tidy data should satisfy the following:
- Each variable must have its own column.
- Each observation must have its own row.
- Each value must have its own cell.
This is the standard way of structuring data. If a data set does not satisfy at least one rule, it is considered messy data. We will spend a lot of time cleaning and preparing data - into tidy data - for further analysis, so this package is critical.
The main functions are:
- Pivoting: This converts between long and wide forms of a dataframe. In the module, functions
pivot_wider()andpivot_longer()are going to be introduced. Also, seevignette("pivot")for more information on pivoting. - Dealing with missing values: You can drop
NAvalues using the functiondrop_na(), or replace missing values with a previous or next value using the functionfill(). You can also usereplace_na()to replace with a certain value.
There are more functions in this package that will make data cleaning easier and more effective. To learn more about tidy data, you may find the paper “Tidy data” helpful.
27.2.4 dplyr
The dplyr package is used to manipulate a data set you created using readr and tidyr.
-
select()allows you to choose variables based on their names.
-
filter()allows you to choose cases based on their values.
-
summarise()turns multiple values into a single summary.
-
arrange()allows you to change the order of the rows.
-
group_by()allows you to perform the mutation by group.
These are some good examples of functions you will learn in the module.
The most representative function supported by tidyr and dplyr is the pipe operator, %>%. By using this operator, it removes the redundancy and inefficiency of duplicated variable names in the code. Not only the pipe operator but there are a lot of other useful functions which makes these two packages essential to learn.
Here are more information on dplyr package.
27.2.5 ggplot2
The ggplot2 package is used to create graphics and to visualize data. With the ggplot() function, you can create almost every graph you imagine of. using aesthetic mapping aes(), geom_point, geom_line, etc. you can set what kind of layers you would like to include in the graph, with what kind of scales, and many more.
For example, I can create a scatter plot using ggplot() with geom_point as follows:
ggplot(mtcars, mapping = aes(mpg, disp)) + geom_point()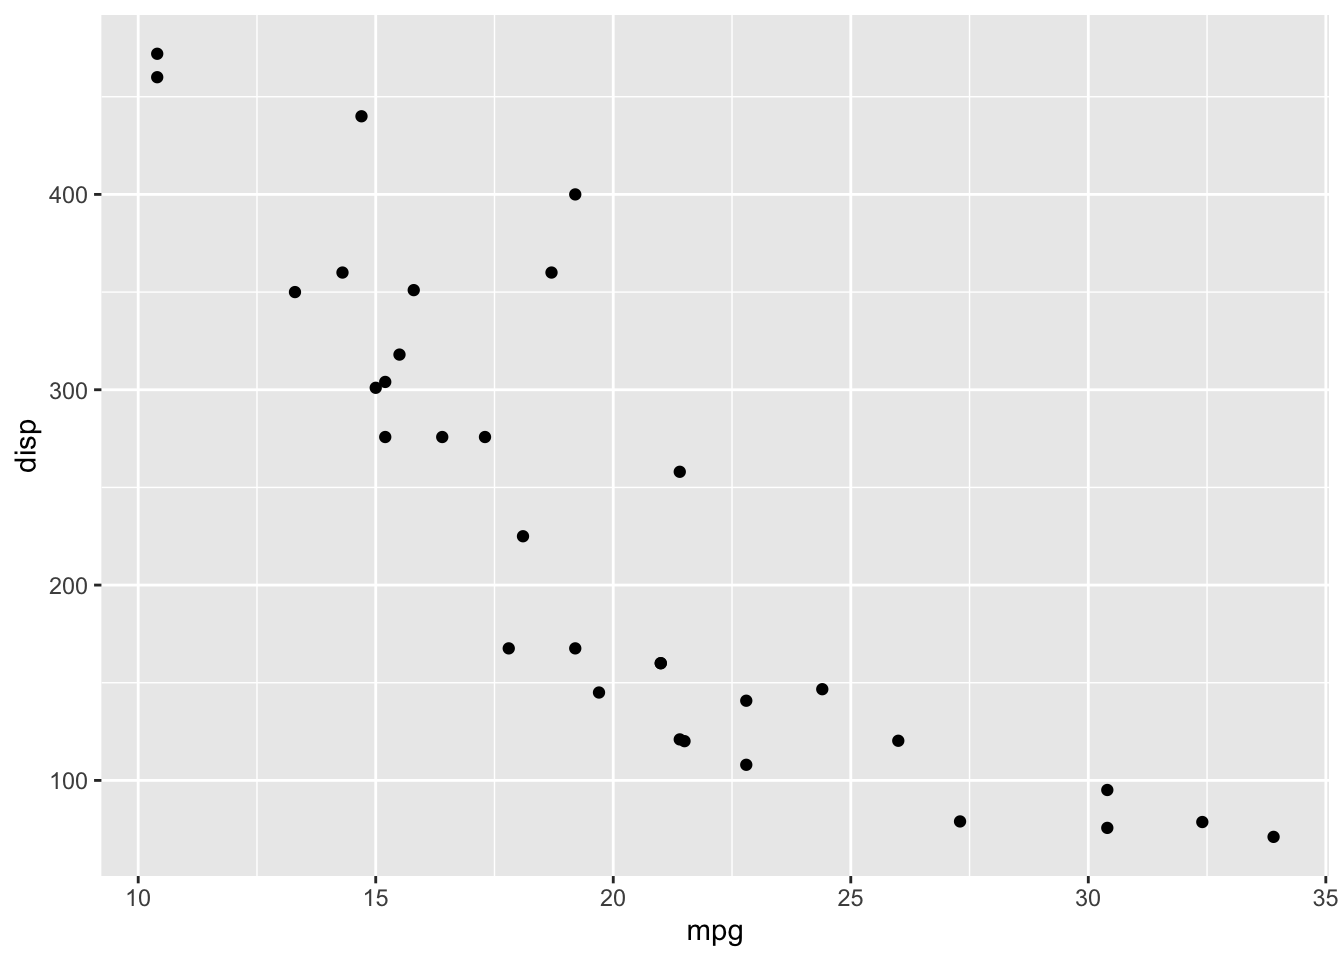
You can fine-tune your graph using faceting specifications, labeling, coordinate systems, changing colours, and more. You can plot almost any type of graphs you could imagine using the package, much more efficiently.
You can always click here to learn more about ggplot2.
Note that most of the visualization work in R is performed using ggplot2 package. So, I recommend you to spend some extra time learning ggplot in future lectures.
27.2.6 purrr
The purrr package in tidyverse is all about iterations. By using purrr, you can perform loops and iteration tasks more intuitively and easier compared to other built-in functions used for iterations. Regardless of programming language, most of the programming tasks require a good understanding and use of loops, and R requires one too. However, this requirement could be easily improved by using purrr.
For more information on purrr, here is an additional resource on purrr package you may find helpful.
27.2.7 stringr
As you can guess from the package name, stringr is a package that provides a set of functions designed to make manipulating strings easier. A string is a one-dimensional array of a bunch of character variables inside single quotes or double-quotes. For example,
"string"
"This is a string"
"this_is_also_a_string"
'string123'
The following examples are all strings. The package stringr allows you to change the string, replace it, split it, count, and many more.
Here is an additional resource on stringr package you may find helpful.
27.2.8 forcats
The forcats package is used to solve problems with factors. Factors are used to handle categorical variables or to reorder character vectors to improve the display.
Categorical variables in a vector is not as useful as integers in a vector, since strings don’t sort well (maybe just in alphabetical order). However, using factors() will avoid these problems happening with a simple vector of strings.
An additional resource on factors may be helpful because a good understanding of factors is needed in order to use the package forcats. Also, see vignette("forcats") for more information on the package forcats.
This is not every package that tidyverse contains, but they are the most important core packages and the packages you will use often. For more information on tidyverse, you can always visit the official tidyverse webpage.
27.4 Exercises
27.4.1 Question 1
What is tidyverse?
a. It is a collection of useful data analysis packages.
b. It includes dplyr, readr, and ggplot2.
c. It allows you to import table easily.
d. All of the above
27.4.2 Question 2
You want to import csv file from your local computer. What package in tidyverse would you use?
a. readr
b. tibble
c. purrr
d. ggplot2
27.4.3 Question 3
You successfully imported the file from the previous question, but you realize some of the rows are missing value and you would like to clean the data. Which package would you use?
a. readr
b. tibble
c. tidyr
d. ggplot2
27.4.4 Question 4
Now the data is “tidy.” You want to create a line graph using the table you imported. What package would you use?
a. readr
b. tibble
c. purrr
d. ggplot2
27.4.5 Question 5
Which package would you use if you want to iterate through a loop?
a. purrr
b. readr
c. tibble
d. tidyr
27.4.6 Question 6
(True or False) You can only make line graphs and bar graphs using the ggplot2 package.
a. True
b. False
27.4.7 Question 7
Select one incorrect statement about the stringr package.
a. It is designed to make manipulating strings easier.
b. Only single quotes can be used.
c. Both single and double quotes can be used.
d. It is used for one-dimensional arrays.
27.4.8 Question 8
Which package in tidyverse would you install if you want to create a tibble?
a. readr
b. tidyr
c. tibble
d. purrr