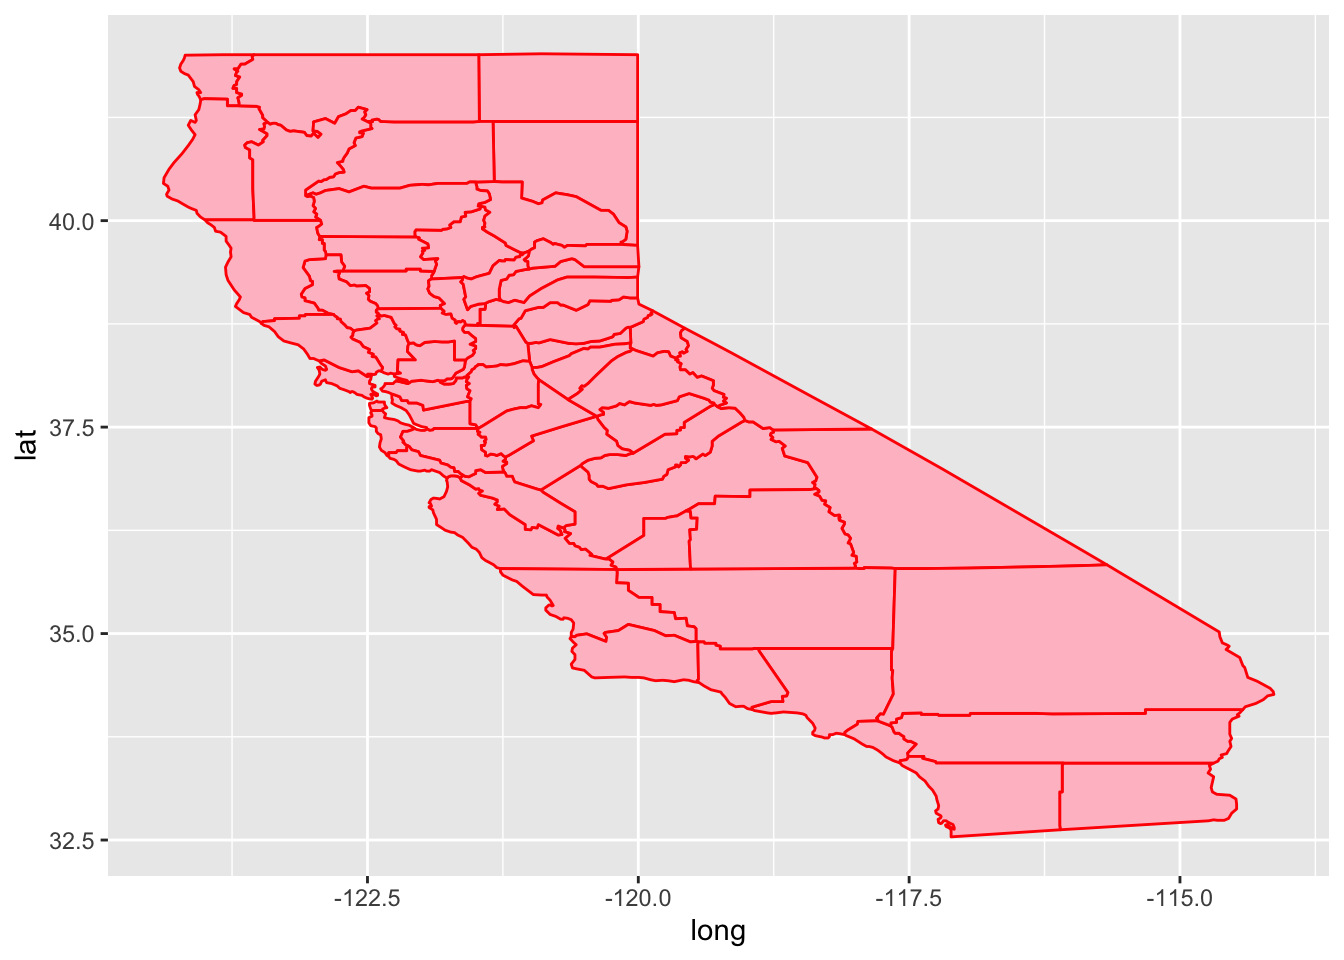
85 Exercise 3
Following the steps above, use the maps package and the map_data() function in R to create a map of all counties of California using geom_polygon(). Border the map with red color and fill with pink inside.
df <- map_data("county", "california") %>%
  select(long , lat, group, id = subregion)
ggplot(df, aes(long, lat, group = group)) +
  geom_polygon(fill = "pink", colour = "red")