63 Simulating datasets for regression
Written by Mariam Walaa and last updated on 7 October 2021.
63.1 Introduction
In this lesson, you will learn how to:
- Simulate data for regression
Prerequisite skills include:
- Familiarity with
set.seed(),runif(),rnorm(),sample()
Highlights
- We can recover the linear regression model from simulated data
63.2 Overview
In the previous section, we learned about how to simulate data. We can build regression models from this simulated data. However, another thing we can do with these functions is build simulated data for regression models.
For example, suppose you were not given a data set but instead was told of the distributions of some variables and given their coefficients for a linear regression model. We can use this information to create the simulated data.
63.3 Idea
To simulate a data set, try writing it down on paper first, and then think about which parts are random, then translate it to code! For example, if you think some number \(y\) is related linearly to \(x\) with a slope of 0.3, with some random measurement error, you could write it down on paper like this:
\[ y = 0.3\cdot x + error \]
Translating it to code might look like:
63.4 Example
Suppose we are given distributions of weights and heights for a population of 50 people, and a linear regression equation for this data, which is the slope and intercept. We can then use this information to simulate the data from the slope and intercept. Lets start with loading the tidyverse.
We can simulate the data as follows.
set.seed(2)

data                error = rnorm(n = 50, mean = 0, sd = 1),
               height = weight * 1.2 + error)
Lets see what this relationship looks like with the regression line and data points plotted.
data %>%
  ggplot(aes(x = weight, y = height)) +
  geom_point() +
  geom_smooth(method = "lm", se = FALSE, formula = 'y ~ x')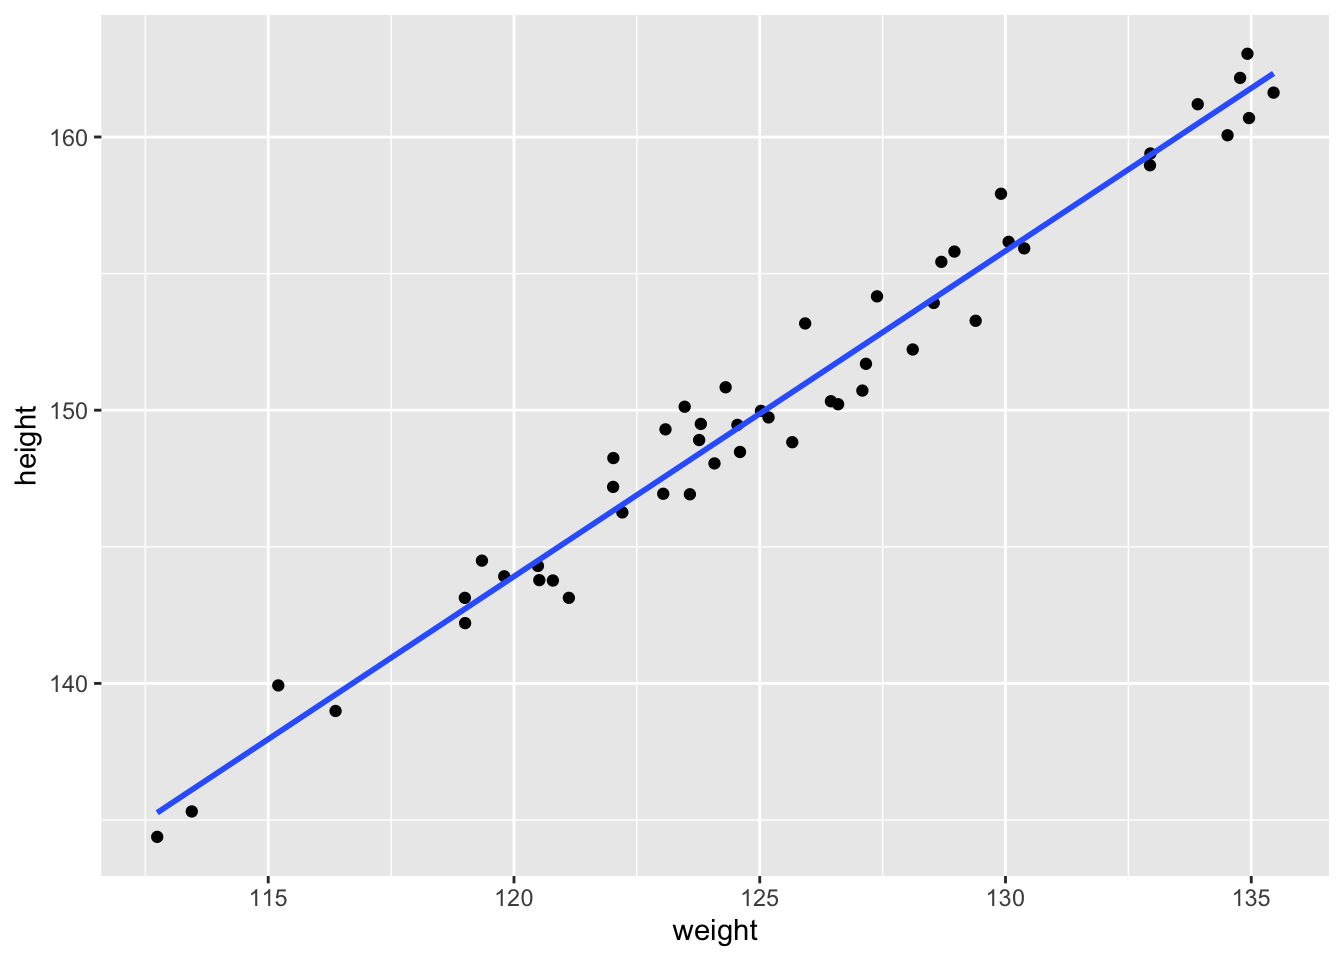
We may use this data set to build a regression models using the lm() function as follows.
lm(height ~ weight, data = data)
#>
#> Call:
#> lm(formula = height ~ weight, data = data)
#>
#> Coefficients:
#> (Intercept)       weight
#>      0.9387       1.1915
As we expect, building this linear regression model successfully recovers the original slope of 1.2.
63.5 Exercises
There are many functions involved when it comes to trying to simulate a data set. These exercises will help you better learn which functions to use for which parts of the simulation.
63.5.1 Exercise 1
When simulating a data set, you will likely need to work with various types of variables – continuous variables, discrete variables, numeric variables, and non-numeric variables.
When it comes to discrete variables (whether numeric, non-numeric, or a mix of both), you will likely want to see a repetition of a finite set of values. There is a certain function out of the handful of functions we learned about for simulating datasets that will be helpful for this task.
For this exercise, youll try to simulate data points for a discrete variable representing the number of times you might pick out a red ball from a jar full of blue, red, and yellow balls. Suppose youll pick out a ball 10 times and put it back every time, and that each ball has equal probability of being picked.
Fill in the blanks for the code below to create data that represents the above scenario.
sample(  = c("Red", "Blue", "Yellow"),
            = 10,
               = TRUE,
            = c(0.33, 0.33, 0.33))
You’ll notice that there are 4 blanks in total that you’ll need to fill.
63.6 Common Mistakes & Errors
Here are some common mistakes and errors you may come across:
- You may be confusing some of the arguments for different distribution functions. Make
sure you are using
runif()to sample points from the uniform distribution andrnorm()to sample points from the normal distribution. - You may be misusing some of the arguments for a function like
sample(). Make sure you read the argument descriptions as well as the given examples in the documentation. - You may forget to set the seed before running a chunk of code, or you may be using a different value for a seed to obtain results you previously got with your code.