84 Exercise 2
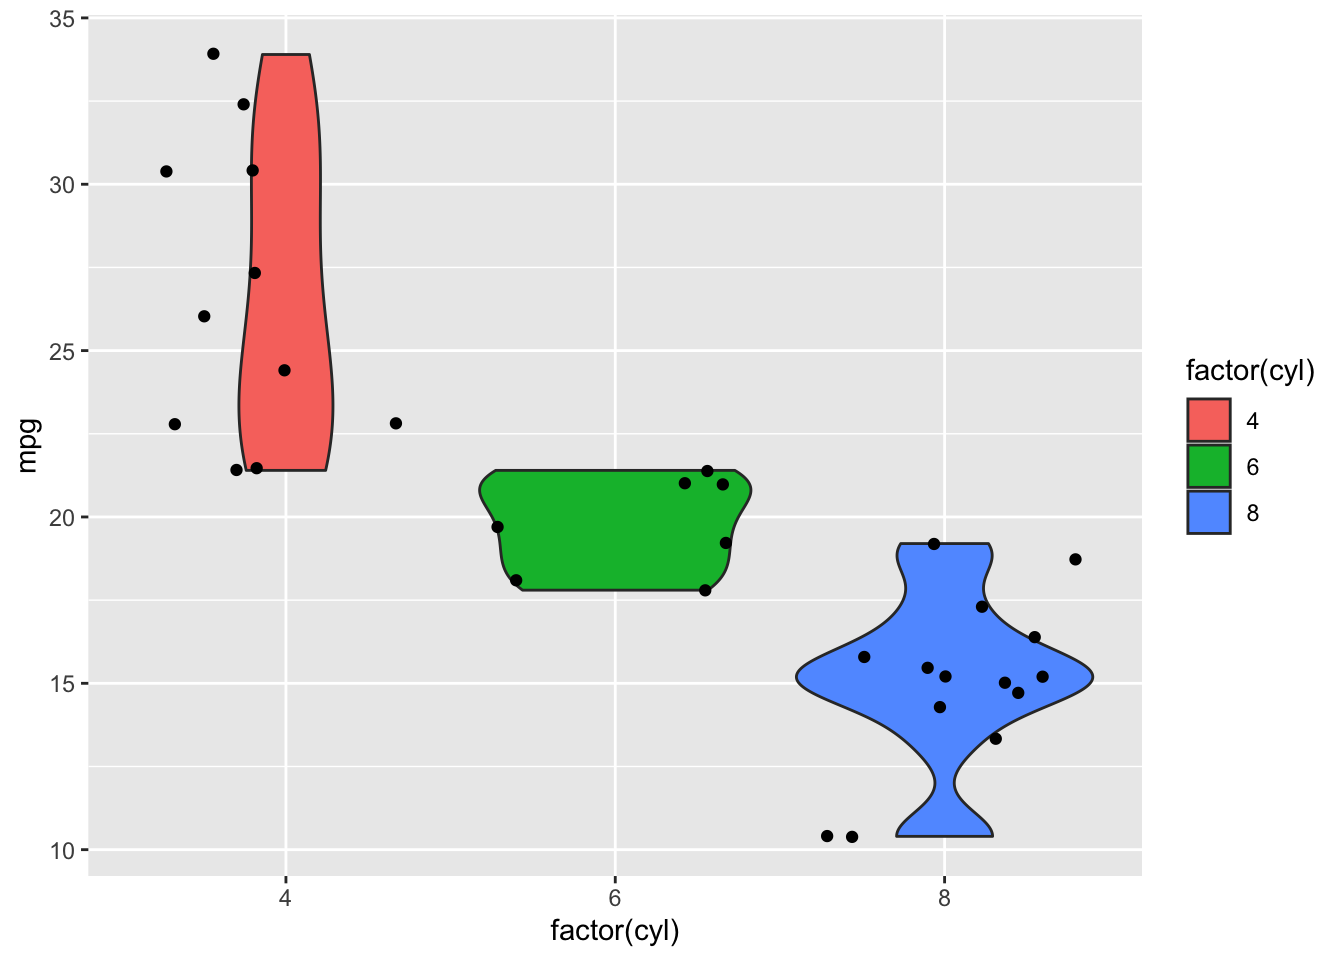
Use the mtcars data set in R to create a violin plot of the Number of cylinders (cyl) as a factor vs Miles/ gallon (mpg) and add a layer of jitters(using geom_jitter). Fill the plot with cyl as a factor and color the jitters black.
ggplot(mtcars, aes(factor(cyl), mpg)) + geom_violin(aes(fill=factor(cyl))) + geom_jitter(color = 'black')