77 Saving graphs
Written by Yena Joo and last updated on 7 October 2021.
77.1 Introduction
There are some situations where you may need pictures of the plots when writing on blogs or sending emails about the data you’re analyzing. In that case, you would wonder how to save and upload the plots created in R.
In this lesson, you will learn how to:
- save graphs
- change graph sizes
Prerequisite skills include:
- You should know how to create graphs using
plot()orggplot()
- You should know the formats of the image (such as png, jpeg, pdf)
Highlights:
77.2 Saving Graphs
77.2.1 Save as Jpeg image
Set the file name for the plot you are going to save using the function jpeg(file = filename.jpeg), if you want to save as jpeg image.
We need to call the function dev.off() after plotting, which will return control to the screen.
jpeg(file="plot1.jpeg")
ggplot(data = mtcars, aes(x=wt, y=mpg, color= wt)) + geom_point()
dev.off()
77.2.2 Save as png image
We can set the resolution we want using the width and height arguments.
We can also set the full local path of the file we want to save if we don’t want to save it in the current directory.
You can save the file as png image by using the function png(file = "filepath/filename.png").
png(file = "plot2.png", width = 500, height = 300)
ggplot(data = mtcars, aes(mpg, wt)) + geom_point()
dev.off()
77.2.3 Save as pdf file
To save a plot as pdf format, we do the following using pdf(file = 'filename.pdf').
pdf(file = "plot3.pdf", eval = FALSE)
ggplot(data = mtcars, aes(mpg, wt)) + geom_point()
dev.off()
77.2.4 Delete the saved image/file
What if we want to delete the file from the directory? We can delete the file using the function base::unlink('FILE NAME').
unlink("plot3.pdf")
77.2.5 ggsave()
Instead of using dev.off(), there is another function we can use to save the created plots. We use ggsave() to the ggplots.
ggsave() includes the following arguments:
ggsave(filename, plot = last_plot(), device = NULL, path = NULL, scale = 1, width = NA, height = NA, units = c("in", "cm", "mm"), dpi = 300, limitsize = TRUE, ...)And these are some core arguments:
-
filename: file name of the graph you are going to save.
-
plot: By default, the plot to save is the last plot displayed on your R file.
- path: path of the directory to save the plot. By default, it is directed to the working directory.
-
width,height,units: You can set the width and height, as well as the units of those measurements.
Here are some examples. Make sure put the correct format of the file after the file name as follows:
ggplot(data = mtcars, aes(mpg, wt)) + geom_point()
ggsave("plot4.pdf")
ggsave("plot4.png")
ggsave("plot4.jpeg")
ggsave("mtcars.pdf", width = 20, height = 20, units = "cm")
If you would like to delete the file, you can use the same unlink() function.
77.3 Exercises
77.3.1 Question 1
Modify this code so you can save the following scatter plot into 10 x 10 cm graph in jpeg format, using ggsave. The file name should be answer1.
ggplot(data = mtcars, aes(mpg, wt)) + geom_point()
ggplot(data = mtcars, aes(mpg, wt)) + geom_point()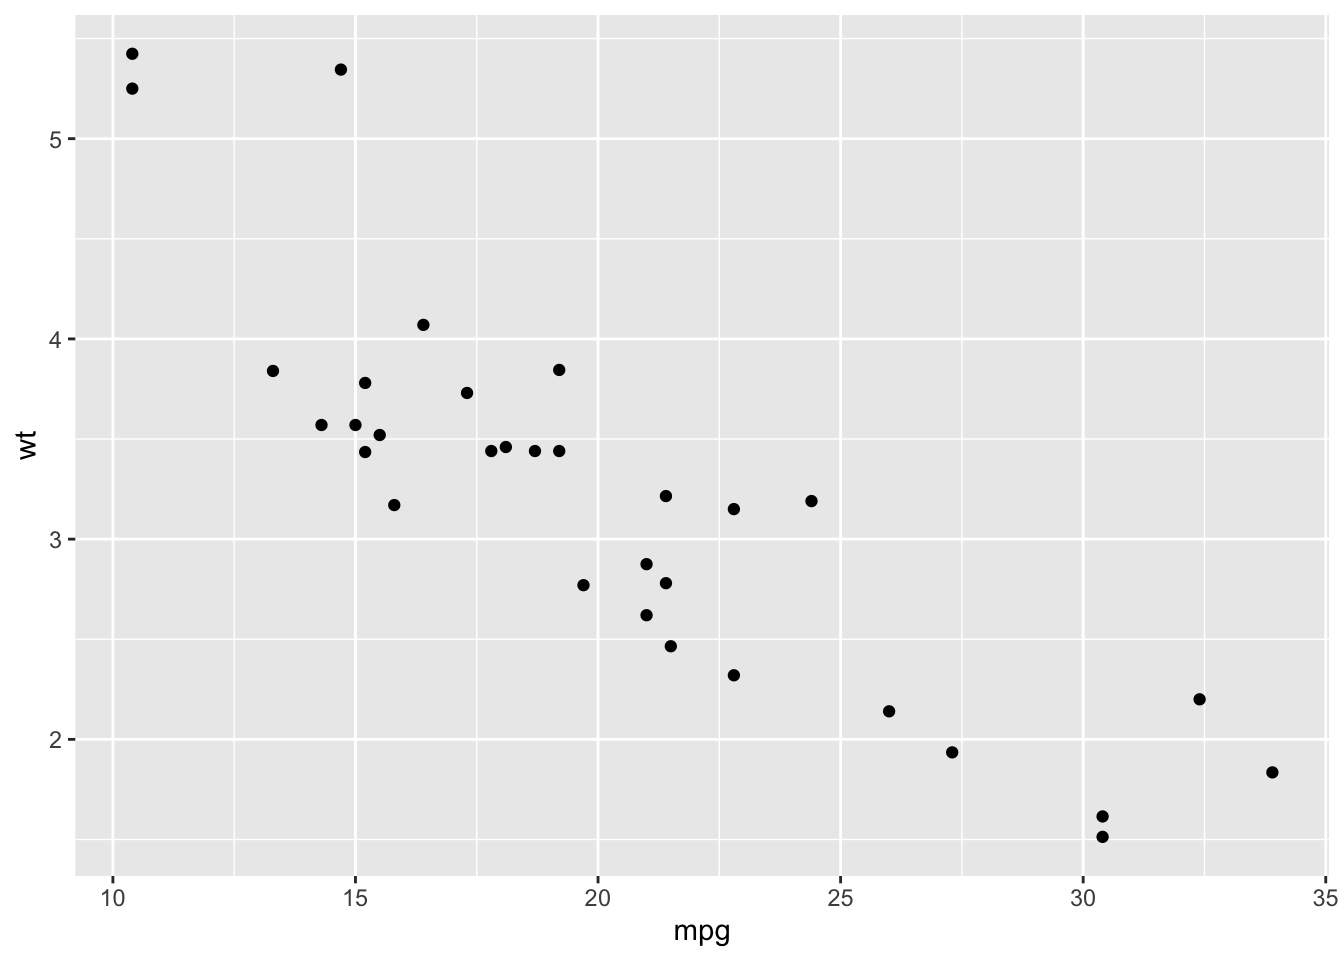
ggsave("answer1.jpeg", width = 10, height = 10, units = "cm")77.3.3 Question 3
Now, using dev.off(), save the following plot as pdf. The name of the file should be iloveplot.pdf.
ggplot(data = mtcars, aes(x=wt, y=mpg, color= wt)) + geom_point()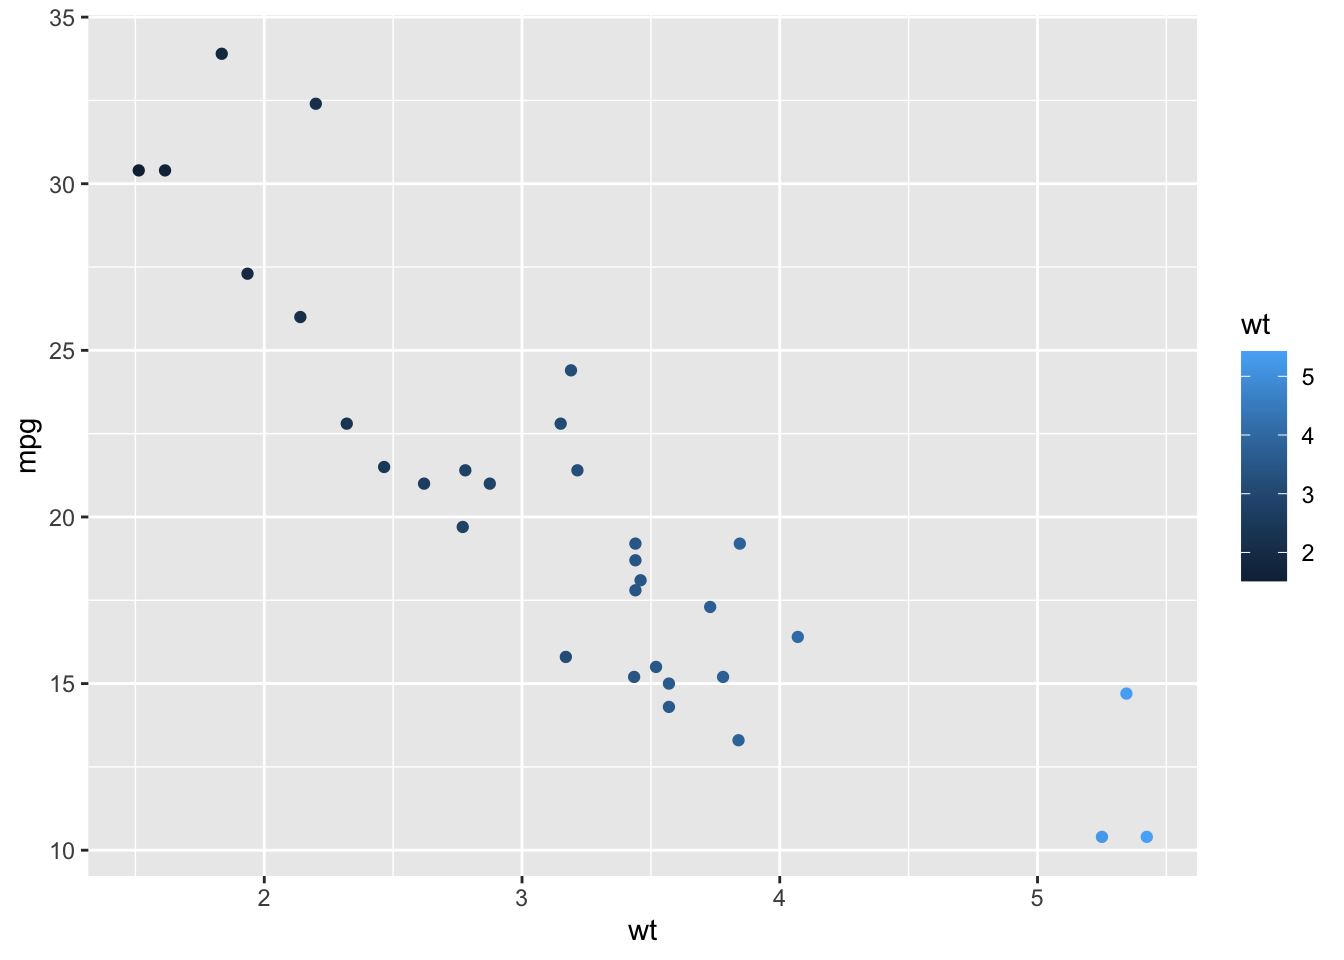
jpeg(file="iloveplot.pdf")
ggplot(data = mtcars, aes(x=wt, y=mpg, color= wt)) + geom_point()
dev.off()
#> quartz_off_screen
#>                 2
77.3.4 Question 4
What does the chunk of code return?
pdf(file = "filename.pdf")- It saves a PNG file of a plot.
- It saves a blank PDF file, and you need to write a separate code to save the plot.
- It saves a PDF file of a plot.
- It does not properly save unless you execute the command
dev.off().
77.3.5 Question 5
What is dev.off() used for?
a. It is a command to finish creating the image file.
b. It is to save the Rstudio environment.
c. It is to delete the image file.
d. It is to edit the image file created.
77.3.6 Question 6
what do the arguments width and height do in a png() function?
a. adjust the size of the final plot in inches.
b. adjust the size of the final plot in centimeters.
c. adjust the size of the final plot in meters.
d. adjust the size of the final plot in feet.