78 gganimate
Written by Matthew Wankiewicz and last updated on 7 October 2021.
78.1 The content
In this lesson you will learn how to:
- Create animated plots with the
gganimatepackage
Some pre-requisites include:
- Having
ggplot2andgganimateinstalled and loaded - Previous use of the
ggplot2package - You may also need to install the
gifskipackage to load animations.
Highlights:
- Using
gganimateis another way to display your data. - The package’s functions can only be used on HTML documents or can be saved and posted, perfect for websites or social media.
- A cheat sheet for the package can be found here.
The gganimate package is an extension of the ggplot2 package which allows you to make your ggplots animated. The animations contained in this package allow you to show trends in data over a period of time or depending on certain states. This can be a useful way to keep readers engaged with your data or can be used if you want to share the trends you find on places like twitter.
Before using gganimate, you’ll have to have a graph set up using ggplot2, once you have the graph you can move on to animating it.
The package can be installed from CRAN using install.packages("gganimate").
78.2 Functions
78.2.1 transition_*():
The transition functions are the most important functions in the package. The functions are what make the plots animated. There are 8 total transition_* functions, 4 will be shown below.
-
transition_states: This function animates graphs based on a certain column in your data. The plot will move based on the different levels in the column. For example, if you have a column with different species of animals, the plot will move/change for each type of animal present in the column.- states: States is the column you want to move the plot by.
- transition_length: This argument changes the length of the transition between the states.
- state_length: This argument changes how long each state is present for.
- wrap: This determines if the animation loops or not. It is set to TRUE by default.
Below is an example of the transition_states function:
broadway <- read_csv("https://raw.githubusercontent.com/tacookson/data/master/broadway-grosses/grosses.csv")

broadway_plot <- broadway %>%
  ggplot(aes(weekly_gross)) +
  geom_histogram(bins = 15)

broadway_plot + transition_states(transition_length = 1,
                                  states = theatre,
                                  state_length = 1)
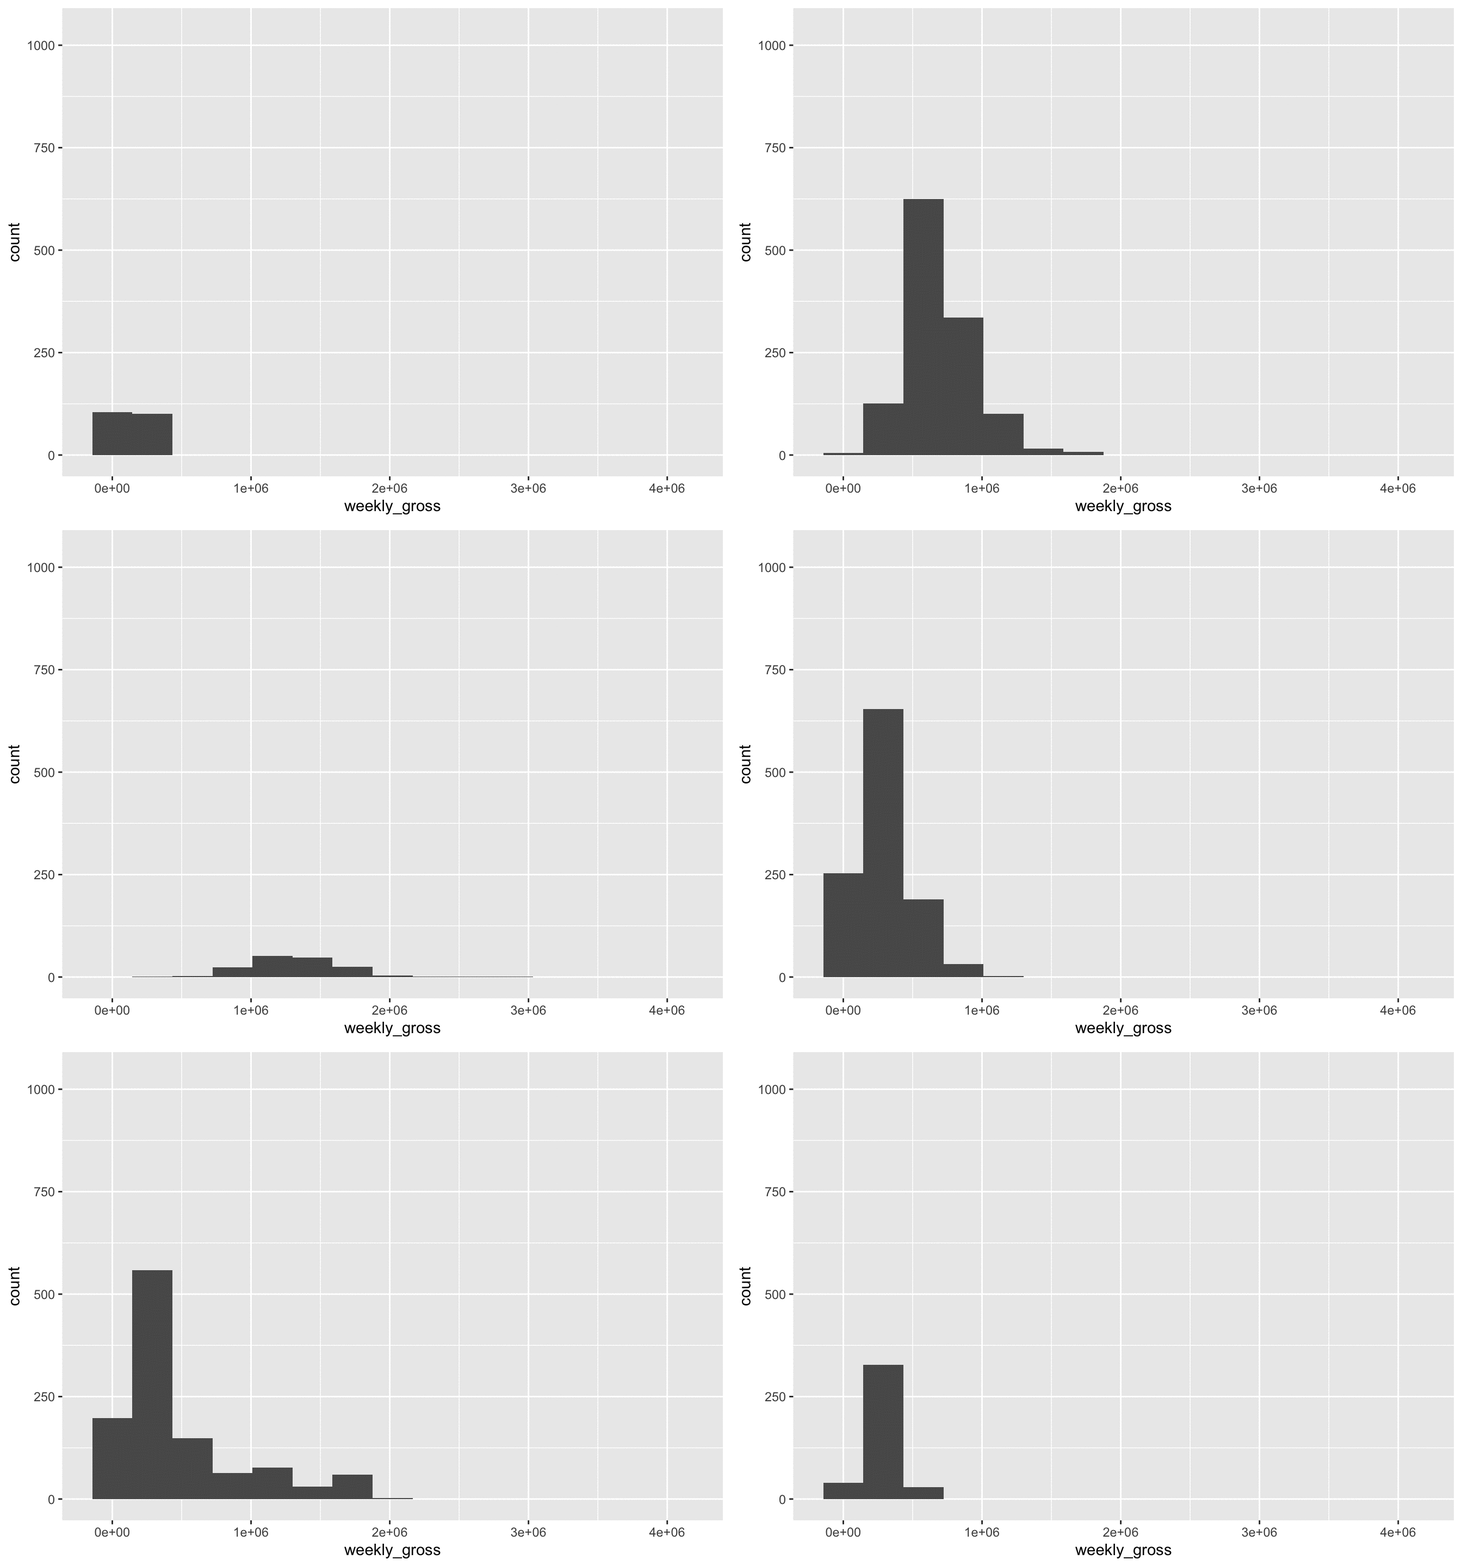
The plot above shows the distribution of weekly gross ticket sales for theatres on broadway. Each state on the plot is a different theatre.
-
transition_time: This function is the same astransition_statesbut uses time to animate instead of variables. This function is very useful for showing trends over time.- time: Time is the only required argument for this function. It represents the time separating each observation in the plot, this can include Days, Weeks or Years.
- range: Range is an optional argument, this represents the range of time you would like to show on the animation. For example, you could look at a certain span of years.
-
transition_reveal: A variant oftransition_time. This function is different fromtransition_timebecause of the way it interprets data for plotting. Instead of strictly going by time values, the function aims for smoother transitions compared totransition_time. Overall, the function will reveal each frame over time. This can be useful for plottinggeom_pathobjects as it will be able to make the line grow over time, like someone is drawing it.-
along: The most important argument for this function. It represents the variable you want R to display state by state. For example, if you set
along = Year, the function will display a new state on the graph for each year in the data. - range: This argument is optional, it allows you to set a range of time for your animation.
- keep_last: Determines if the last row will show up for future frames. It is set to TRUE by default and doesn’t really need to be changed.
-
along: The most important argument for this function. It represents the variable you want R to display state by state. For example, if you set
-
transition_filter: Instead of having new stages based on different levels of a variable or by periods of time,transition_filtershows different states based off of thefilterfunction.- transition_length: This argument changes the length of the transition between the states.
- filter_length: This argument changes how long each filter state is present for.
- You will also need to add filter expressions. You can place as many expressions as you want, these will become the states of your animation. Write them in the form
x < y,var == "dog", you don’t need to include the filter function. - wrap: This determines if the animation loops or not. Set to TRUE by default.
- keep: Tells R if you want to keep rows that don’t match the filter in your data. The main use of this argument is with “exit functions” and how they operate. Exit functions will be discussed later.
Some other transition functions include transition_null, transition_manual, transition_components and transition_layers. These functions aren’t used as much as the other 4 shown, more information about the functions can be found in the gganimate documentation.
78.2.2 More Aesthetic Functions
Along with the transition functions, there are other gganimate functions which can help your animations look better. There are two types of functions which can help your animations: Enter/Exit functions and the ease function.
The Enter/Exit Function determine how the data for each state will enter the graph. Instead of having the points on a graph appear/disappear, these functions will add more interesting transitions, like shrinking/growing or fading in/out. The gganimate website gives some helpful information about these functions and can be found here.
The ease_aes function changes how the animation moves between its states on the plot. There are many different types of easing that can be applied onto animations, each having a different effect. A list of easing types and a visual demonstration of how they affect the animation can be found on the R bloggers site.
Another function that can be used with gganimate is ggtitle. Using this function allows us to have a title which changes with each state of the graph. For example, if we have a histogram showing the distribution of ages by country, we can use ggtitle to change the title depending on which country it is showing.
- To have the title change by state for
transition_stateswrite your title followed by “{closest_state}.” - To have the title change for
transition_revealuse “{frame_along}” after your title. - To have the title change for
transition_filteruse “{closest_filter}” after the title. - To have the title change for
transition_timeuse “{frame_time}” after the title.
78.2.3 animate
The animate function is used to render the animations created. In these renderings you can change the image quality, number of frames, frames per second and many other options. The most important arguments of animate will be discussed below:
- plot: The plot argument is simply your plot. This can be the entire plot expression, or you can save the expression as an object use that.
- nframes: This is the number of frames in your animation. It is set to 100 by default but you can change it to match the number of states there are in your plot.
- fps: This is the frames per second. If you want your animation to be really slow, lower the frames per second. This argument defaults to 10.
- duration: This is how long you want your animation to be.
- device: This argument changes how the images are stored for the animation. By default they are saved as .png.
78.3 Common Errors
- Error: Provided file does not exist.
- This means that you are using a keyword that does not match the transition function. To fix this, you need to change to a different keyword.
-
transition_statesmatches with “{closest_state},”transtion_revealmatches with “{frame_along},”transition_filtermatches with “{closest_filter}” andtransition_timeuses “{frame_time}.”
- Error: transition_filter requires at least 2 filtering conditions
- Make sure you have 2 filtering conditions defined.
- If you have 2 filtering conditions already, you will need to add the
transition_lengthandfilter_lengtharguments to your function.
- Error in transform_path(all_frames, next_state, ease, params$transition_length[i], :
transformr is required to tween paths and lines
- To fix this, install the
transformrpackage.
- To fix this, install the
78.4 Test your Understanding
The next three questions will use the code chunk below:
caribou_timeplot <- caribou %>%
  filter(animal_id == "GR_C01") %>%
  filter(event_id < 2259197491) %>%
  ggplot(aes(longitude, latitude)) +
  geom_path() +
  ggtitle("Timestamp: {****}")

caribou_timeplot + transition_*(timestamp)
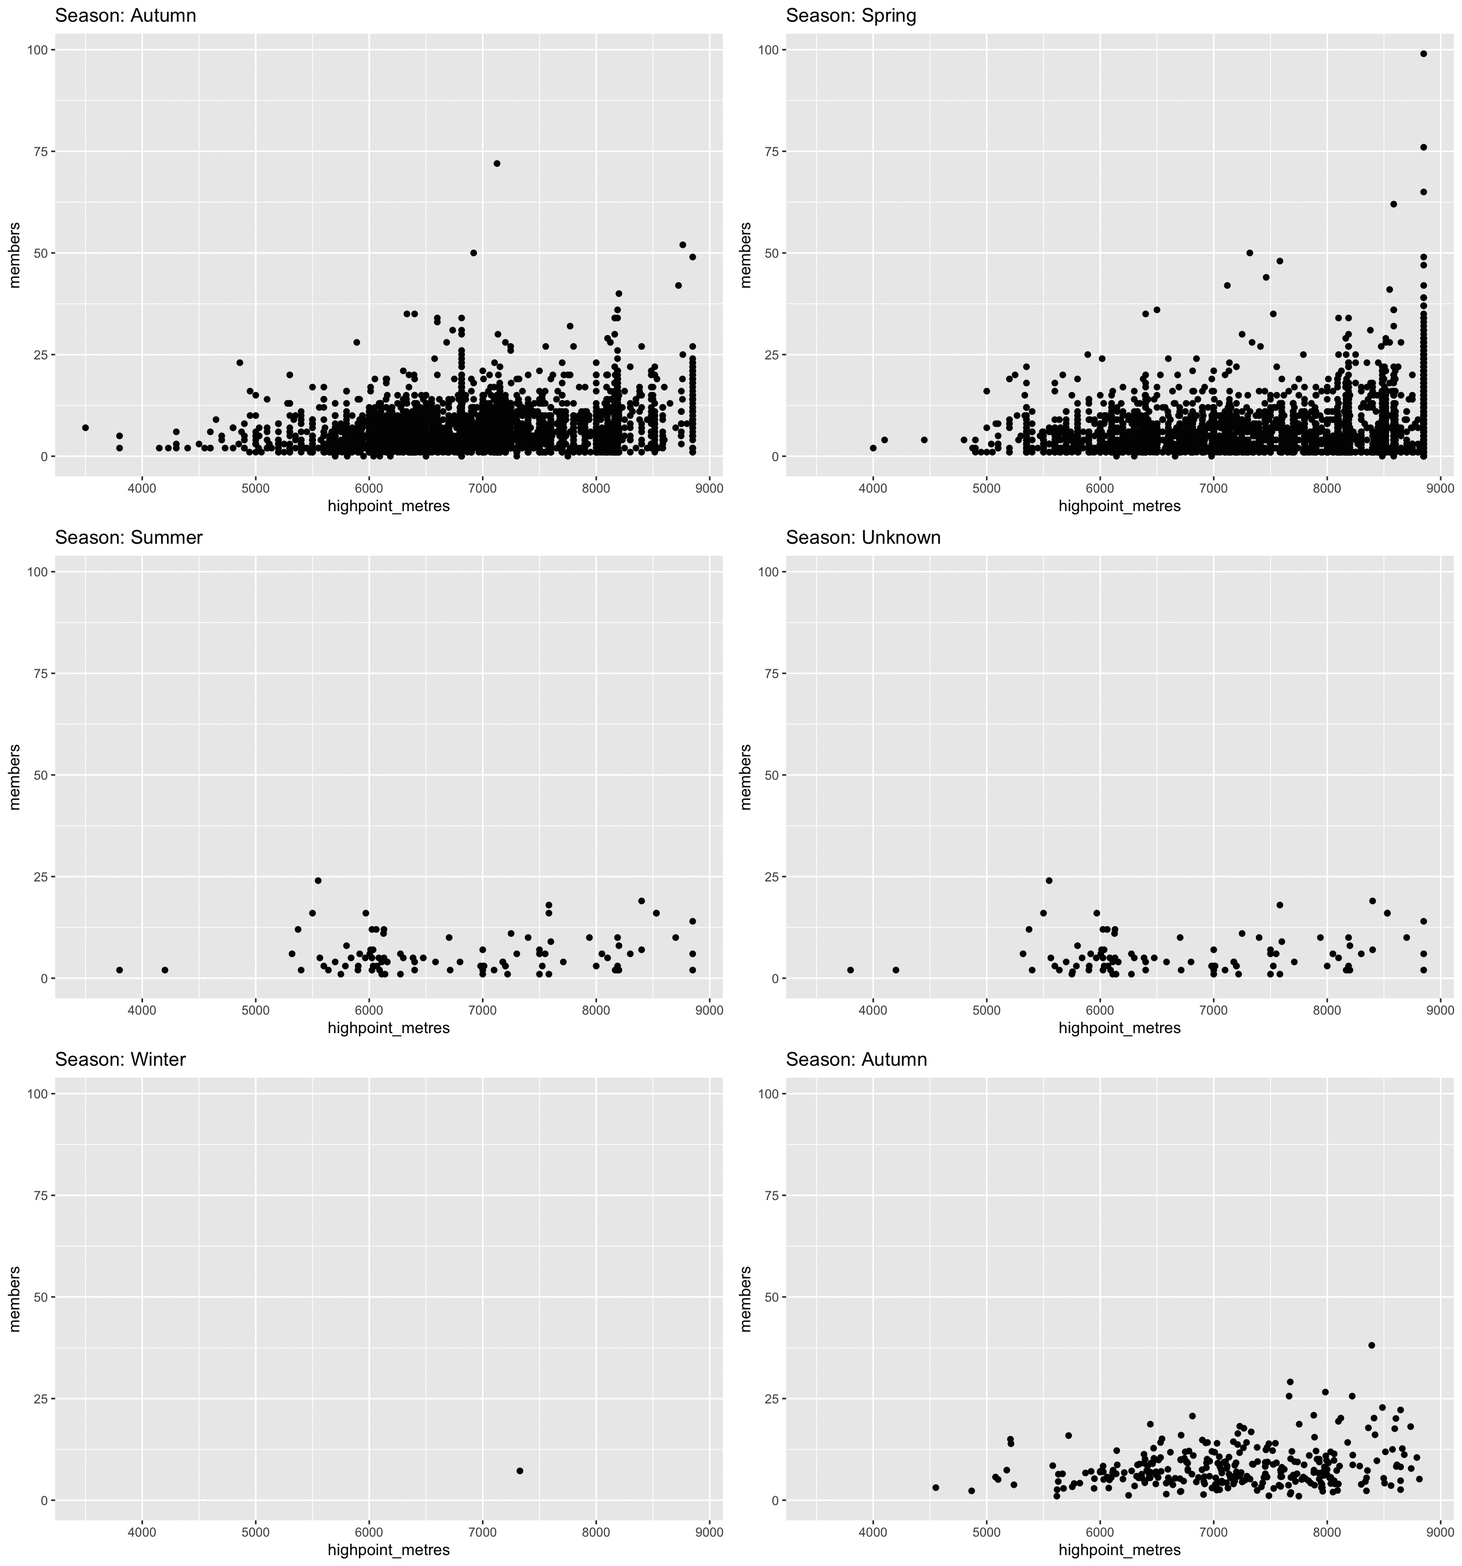
The final question will use the plot below:

78.5 Helpful Links
Some helpful links include:
The
gganimatewebsite: https://gganimate.com/Katherine Goode’s presentation on
gganimate: https://goodekat.github.io/presentations/2019-isugg-gganimate-spooky/slides.html#1The rOpenSci Labs github page for learning
gganimate: https://github.com/ropensci-archive/learngganimate
78.6 Questions
- True or False,
gganimateplots will work if the output file is a PDF?
- True
- False
- True or False,
gganimateis part of theggplot2package?
- True
- False
- If I want my
gganimateplot to loop, which argument should I use?
loop = TRUErepeat = TRUEwrap = TRUE- That argument does not exist
- Which function is best suited to animate an line that changes over time (like yearly population totals)?
transition_states()transition_time()geom_point()transition_line()
- What is the
renderfunction used for?
- Render animations that were created
- Change the scales of the plot
- Make the plot static
- None of the above
- If I want to make a moving plot that changes depending on a categorical variable, which function should be used?
transition_states()transition_time()transition_reveal()transition_cat()
- What does the
ggtitlefunction do?
- Creates a title that does not change
- Creates a new plot
- Creates a title that changes depending on the state
- None of the above
- If I am using
transition_filter, whichggtitlecall should I use?
- “{closest_filter}”
- “{frame_time}”
- “{closest_state}”
- “{frame_along}”
- What is the default file type for the
animatefunction?
- gif
- jpg
- html
- png
- What do enter/exit functions do?
- Make the animation static
- Change how the animation begins/ends
- Add more plots
- Add a title to the plots