44 Mixed-effect linear models with lme4
Written by Yiqu Ding. and last updated on 7 October 2021.
44.1 Introduction
lme4 is in short for linear mixed effect models using Eigen and S4. It is a package in R that allows you to fix linear and generalized linear fixed-effect models. S4 stands for the class and methods that the models are represented and Eigen is simply the name of the C++ library that is used to implement the algorithm.
Use this code to install and load the lme4 package:
44.1.1 Motivation
Why is it so important to identify the type of effects in a model? Take this simple example as motivation:
An officer in the student life office at UofT wants to study the relationship between the hours of study and students’ final grades for STA130. To do that, the officer is distributing a survey among students which collects their hours of study, their final grades and the tutorial section that they belong to. The intuition here is the more hours spent studying, the higher grades you end up with. But one thing to be considered: does the tutorial section matter at all? Or in stats language, are students identical independently across tutorial sections? The answer is probably not. Different TAs have different expectations of students and are likely to have different grading styles, the time slot of the tutorial itself can be an indicator of studying type, etc. These variables impact the variable of our interest: final grade and therefore we want to account for them, but they are not something we want to estimate, and we give it a name: random effect.
To further see the importance of identifying random effects from fixed effects, consider a pharmaceutical firm studying the effects of a new drug on controlling blood pressure. We have a control group that does not take the drug and a test group that uses the drug. The data includes the blood pressure over time, age, gender, current health condition and the dose of drugs taken which includes 0 for none, and 1-3 for different levels of intakes. Again, random effects are the variables that will affect our variable of interest but are not what we want to estimate, in this case, age, gender and current health condition are random effects because they sure are related to blood pressure, but this variability is not related to the drug. The only fixed effect here is the level of drug intake. This is something very realistic because you do not want to claim that a drug is 99% effective in controlling blood pressure when 90% of the variability is explained by random effects that are not accounted for.
44.1.1.1 Quick Check
This question is rephrased using an example from Roback and Legler at https://bookdown.org/roback/bookdown-BeyondMLR/ch-corrdata.html
“A teratogen is a substance or exposure that can result in harm to a developing fetus. An experiment can be conducted to determine whether increasing levels of a potential teratogen results in increasing probability of defects in rat pups. We will simulate the results of an experiment in which 24 dams (mother rats) are randomized to four groups: 3 groups of 6 dams each are administered a potential teratogen in high (3 mg), medium (2 mg), or low (1 mg) doses, and the fourth group serves as the control. Each of the 24 dams produces 10 rat pups, and each pup is examined for the presence of an anomaly or deformity.”
Quiz
- Is the difference across pups from different dams considered fixed or random effect?
- Is the difference across different does of usage considered fixed or random effect?
44.2 Fit a model with lmer()
Now we will show the use of lmer() by demonstrating an example using data in Winter.B (2013). Linear models and linear mixed-effects models in R with linguistic applications. arXiv:1308.5499.
44.2.1 Data
# Reads in the data as csv
politeness <- read_csv("data/politeness.csv")# Take a glimpse
#> Rows: 84 Columns: 5
#> ── Column specification ────────────────────────────────────
#> Delimiter: ","
#> chr (3): subject, gender, attitude
#> dbl (2): scenario, frequency
#>
#> ℹ Use `spec()` to retrieve the full column specification for this data.
#> ℹ Specify the column types or set `show_col_types = FALSE` to quiet this message.
kable(head(politeness))| subject | gender | scenario | attitude | frequency |
|---|---|---|---|---|
| F1 | F | 1 | pol | 213.3 |
| F1 | F | 1 | inf | 204.5 |
| F1 | F | 2 | pol | 285.1 |
| F1 | F | 2 | inf | 259.7 |
| F1 | F | 3 | pol | 203.9 |
| F1 | F | 3 | inf | 286.9 |
Politeness is a data set with 84 observations and 5 variables, we show the first 6 lines in the table above. I downloaded it here: http://www.bodowinter.com/tutorial/politeness_data.csv. The variables include:
- subject: Each represents a different speaker;
- gender: Sex of each speaker;
- scenario: 7 difference scenarios that the speaker is asked to speak in;
- attitude: whether the speaker was speaking politely or informally;
- frequency: the pitch of speaker measure in Hertz.
Observe the diagram below and think about why a simple linear regression is not appropriate.
#Some visualization
g1 <- ggplot(data=politeness)+
  geom_boxplot(aes(x=politeness$subject,y=politeness$frequency, col=attitude))+
  theme_minimal()+
  ylab("Pitch(Hertz)")+xlab("Sbuject")
g1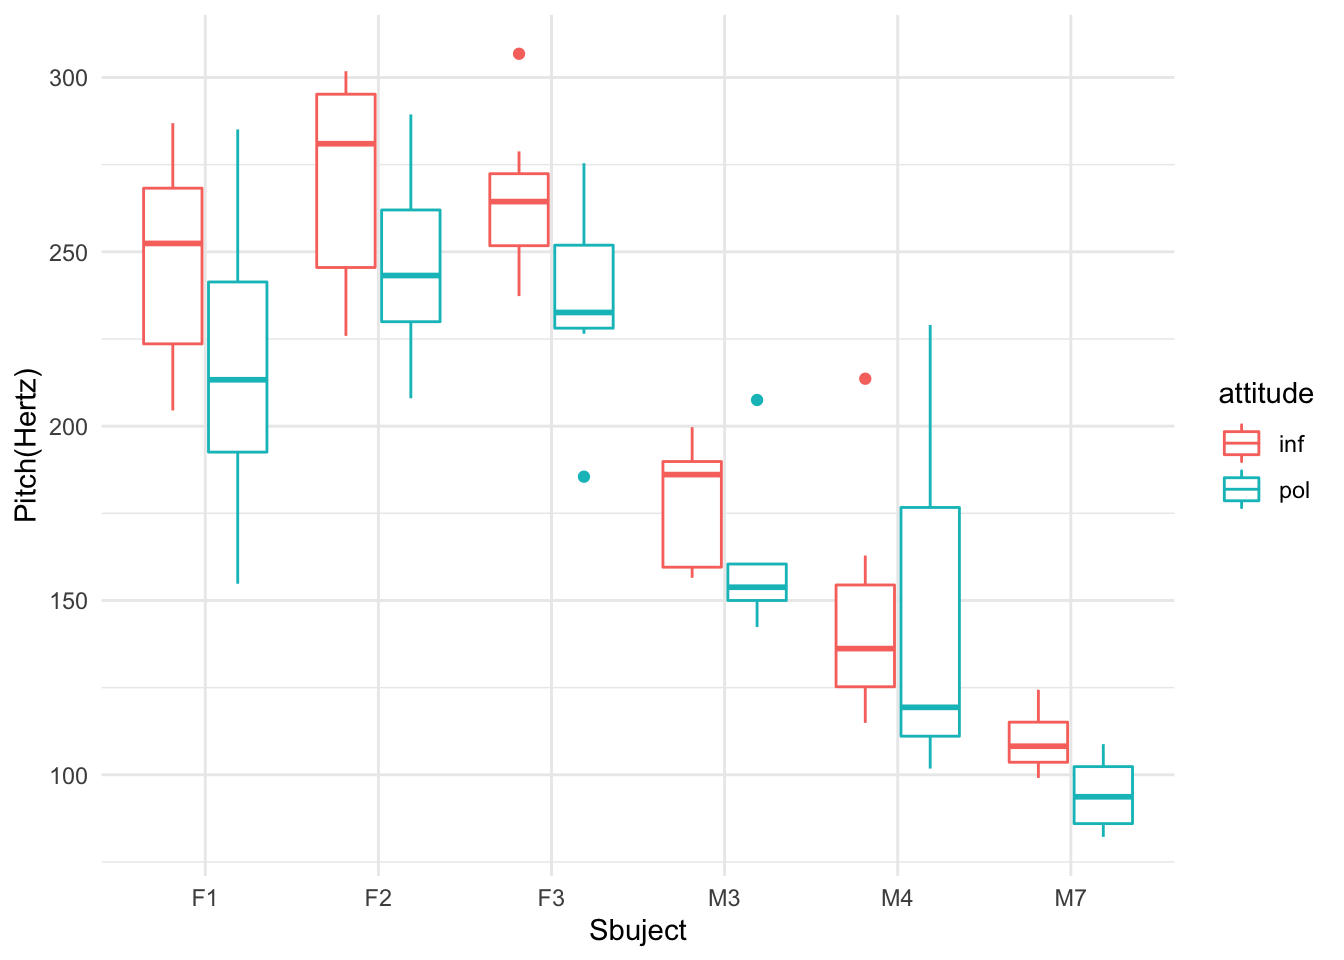
Figure 44.1: Pitch Varied By Subjects
44.2.2 Syntax
To start modeling with lmer(), all you need is to tell R the formula that you want to regress by and a data set that it needs to use. On top of the OLS formula \(y = X\beta+\epsilon\), linear mixed model requires an additional random effect term specified by \(y=X\beta+Zb+\epsilon\), where \(Z\) is the matrix of coefficients for the random effect variable.
Within the random effect variable, there are a few expressions you can use. Generally, random effects are expressed in the format of (expr | factor). So (1 | random factor) is the simplest random effect there is, where you are assigning a random intercept for each level of the random factor. If instead you want different slopes for each level of your random factor you can use the term (1 + fixed | random factor), where you still have 1 which gives the random intercept for levels in variable, but also f for different responses to f. For models with random slopes only, use (0 + fixed factor | random factor). You can make the expression shorter by removing the 0. Following this logic, what else could you write if you want random slopes for the variable only?
Quiz
- To assign different slopes to levels of a variable, which line of code should be used?
(1 | variable)(2 | variable)(fixed factor | variable)(1 + fixed factor | variable)
44.2.3 Exercise
I encourage you to download the data and work on the examples with Rstudio on your own device so you can refer back to it when needed. Fit a mixed-effect model predicting the pitch frequency with attitude and gender as the fixed effect, and subject and scenario as the random effect with random intercept. Name it m1:
Now modify the code to fit another model and name it m2. Make everything the same except for assigning random slopes to the random effect variables.
44.3 Understanding the Results
Take a look at your results of model 1. What do you see?
Good! You observed that the results contain two parts: fixed effects and random effects. Let us start with the simple one. The fixed effect part works just the same as what you would expect from a simple lm() model, so let’s test your knowledge of the previous modules here with the fixed effect.
Now we will look at the random effects part. Notice that each subject has its own intercept, but the coefficients for attitude and gender is identical for each subject. This is exactly what the model would do with our formula for model 1: expect different intercepts for the variable in the bracket which is subject and scenario and produce fixed effect coefficients for the two fixed effect variables attitude and gender.
How is our model 2 different from model 1?
You probably see where I am going with this: it now allows for different slopes rather than different intercepts only. The way I understand this is, the random intercepts are saying okay, you get to start at different points but you have to develop in the same trend; while random intercepts open up the possibilities a bit more and are like now each level can do whatever they want after you start. For example, observe your coefficient matrix for subjects, hopefully, you will see that now the \(\beta_{attitude}\) for each subject is different while the \(\beta{gender}\) is constant. This corresponds to our formula because we only asked for different slopes for the attitude variable. Notice these different \(\beta\)s for attitude are still all negative indicating people tend to lower their pitch when they are trying to speak formally, but to what degree is explained by difference across subjects.
44.4 Quiz
Let’s test your learning outcome using the sleepstudy data that comes with the lme4 package! Once you load the lme4 package with library, you can use str(sleepstudy) to view some basic information of the data. The data is used by Bates et al. in “Fitting Linear Mixed-Effects Models Using lme” and was originally used in a sleep deprivation study (Belenky et al. 2003). In your own R studio, load the data and get yourself familiar with it!
44.5 Remarks
44.5.1 Missing Random Effect
# lmer(frequency ~ attitude, data=politeness)Copy and paste this code above and try to run it. You will realize that this runs to an error, and that is because you will need to incorporate a random effect for lmer() to work. Otherwise there is no point using lmer() specifically.
44.5.2 Do you really need the full model?
Remember in modeling we always want to predict the most information with the simplest model. Especially with the random effect variables, you want to always make sure that they do improve your model. You will learn more about model comparisons in this book. Keep going:)
44.5.3 How do I properly cite lme4?
If you are using lme4 in any kind of publication, use “Bates D, Mächler M, Bolker B, Walker S (2015). “Fitting Linear Mixed-Effects Models Using lme4.” Journal of Statistical Software, 67(1), 1–48. doi: 10.18637/jss.v067.i01". Also make sure you acknowledge the name of the package and function you use even when not creating something that is not being published.
44.5.4 Further Readings
- Jared gives a neat example for introductory lmer() usage with a characteristic study example, with code here: https://www.jaredknowles.com/journal/2013/11/25/getting-started-with-mixed-effect-models-in-r .
- Laurent and Rens used a slightly more complex data set of popularity to demonstrate the use of lme4 as well as some nice refresh on residual checks using Q-Q plots(https://www.rensvandeschoot.com/tutorials/lme4/).
- If you prefer a video tutorial, check the video Mike Crowson has put together: https://www.youtube.com/watch?v=8r9bUKUVecc.
- For some more detailed correlation between model formulas and R expressions, check Livius’s answer under this stackexchange question: https://stats.stackexchange.com/questions/13166/rs-lmer-cheat-sheet. The question in general answers a lot of common questions towards the use of lmer().
44.6 Reference
Bates D, Mächler M, Bolker B, Walker S (2015). “Fitting Linear Mixed-Effects Models Using lme4;
Belenky G, Wesensten NJ, Thorne DR, Thomas ML, Sing HC, Redmond DP, Russo MB, Balkin TJ (2003). “Patterns of Performance Degradation and Restoration During Sleep Restriction and Subsequent Recovery: A Sleep Dose-Response Study.” Journal of Sleep Research, 12, 1–12. doi:10.1046/j.1365-2869.2003.00337.x.
Roback P, Legler J, Beyond Multilevel regression: Applied Generalized Linear Models and Multilevel Models in R.
R Core Team. 2020. R: A Language and Environment for Statistical Computing. Vienna, Austria: R Foundation for Statistical Computing. https://www.R-project.org.