110 Getting started with Shiny
Written by Matthew Wankiewicz and last updated on 7 October 2021.
110.1 About
Shiny apps are a great way to show the characteristics of a dataset interactively. Shiny apps are easy to create and can exist as a standalone website, or can be included in R Markdown documents as well. Shiny apps can also be used to demonstrate how statistical processes work and can be used for teaching.
Some amazing examples of Shiny apps include:
-
https://danielrivera1.shinyapps.io/Regression2/?_ga=2.5896307.1991017896.1618937285-2097610576.1597102858
- This app looks at the steps at running linear regression on data collected from Colombia. The app goes step-by-step and then includes a quiz at the end.
-
https://cjteeter.shinyapps.io/MastersGolf/?_ga=2.1308913.1991017896.1618937285-2097610576.1597102858
- This app collected data from the Masters golf tournament and shows the different scores players received over the years, along with a tab that looks at a player’s individual performance.
- More examples of Shiny apps can be found at: https://shiny.rstudio.com/gallery/
110.2 The Parts
The process for creating Shiny apps is fairly simple. First, you will want to install the shiny package in R, this package allows you to create your apps.
Next, you can go to the top left in your RStudio window (same applies for RStudio cloud) and click on the blank page with a plus on it. After doing this, go down to “Shiny Web App…” and click on it. This will create a new folder where your Shiny App will be stored. This new file will already contain a default Shiny App which is a simple example of an app.
- The same can also be done by creating a new R project for a Shiny app.
110.3 Making the App
Shiny apps have three main sections for code. We will briefly look at them now and then go more in depth in the next section.
-
ui:- The
uisection will control what the person using your Shiny app will see. This includes things like what the title is, how many tabs will be included on the page and what type of inputs your app will include (sliders, dropdown menus, etc.)
- The
-
server:- The
serversection will control what the viewer cannot see. The server section can be used to create predictions, plots or other calculations. You can also use the server section to include a text write-up below a plot.
- The
-
Other things:
- You can also write code before the
uiandserversections. This can be used to create models, do data cleaning or call in other datasets after you have cleaned them in other R scripts.
- You can also write code before the
After you have completed the three sections, you can run your app by either clicking the “Run App” in the top right corner or running the shinyApp function at the bottom of your R script.
110.4 Arguments
ui:
Your ui section will be usually be contained in the fluidPage function. This is where you will include things like your title, the headers for different tabs on the page and any filters or sliders you want to include on your page.
To create a title, you can use the
titlePanelfunction, you can simply write the function and then your title on the inside, for example:titlePanel("My Shiny App").-
Next, you will want to work on the main parts of the page, you can either use the
tabPanelfunction if you plan on having multiple tabs, or thesidebarPanelfunction if you plan on having one tab/page.- If you plan on having multiple tabs, the
tabPanelfunction can be used withsidebarPanelto make your pages. The function’s arguments include a title and then you can move on to customizing the sidebar. - To customize the sidebar, first call the
sidebarLayoutfunction, this will allow you to include side and main panels.
- If you plan on having multiple tabs, the
-
Next, call
sidebarPaneland include anything you want to filter your data by or anything you want to calculate. This can include picking teams to make a prediction of which team will win or picking a range of values to see what will fit into the option.- The different options for filtering include slider inputs so the user can pick a range of values to include, numeric inputs so the user can pick an exact value, dropdown menus to select a specific option, checkboxes and many more!
- After you have edited the sidebar to your liking, you can add in the placeholder for the main panel, this will include things like tables, plots, text or maps that will change depending on what happens in the sidebar.
- If you want to create a changing text box in your main panel, use the
textOutputfunction to do so. Inside the function, write in a keyword that will be used in the server section to change the plot. - If you want to create a table, use the
tableOutputfunction and for plots use theplotOutputfunction.
- If you want to create a changing text box in your main panel, use the
server:
As we saw in the earlier section, the server part of a Shiny app will be used to write code that will change the app, but the viewer will not see it. When making the server, it will be written as server <- function(input, output) {}. With your code being written inside the {}. The code written in this function will depend on what you want to show the viewer and what you have defined in ui.
- If you decided to include a text box in your Shiny app, you will need to use the
renderTextfunction. This is where you can write sentences and change them depending on what is selected in the sidebar. For example, if you wanted to say which animal was selected out of a list, your function will look like:output$sentence <- renderText({paste("you have selected", input$animal)})- A few things to note, you must save each textbox, table or plot under output$keyword, where the keyword is the one you defined in the ui phase. Also, the use of
animalafter input was to represent what was selected in the sidebar.
- A few things to note, you must save each textbox, table or plot under output$keyword, where the keyword is the one you defined in the ui phase. Also, the use of
- The same idea goes for plots and tables, this time you will use the
renderPlotandrenderTablefunctions to create the outputs.
110.5 Live Coding
- Example 1:
- Example 2:
To get your access token from GitHub use usethis::browse_github_token, it will open up a new page and you can access a token from GitHub there. It will also tell you how to store your token after running the function. (This is also covered in the GitHub lessons.)
110.6 After you code your app
Once your code is completed and everything works properly, you can publish your app. Publishing the app requires an account but is free to do. To publish your app, click on the blue circle beside the “Run App” button on the header of app’s code. You will want to create your app using shinyapps.io, this is the free version of publishing your app. Once you do this you will likely have to create your shinyapp account and enter in your secret key for your account. After you’ve done this, your account should be connected and you can publish your app. The url for the app will likely be username.shinyapps.io/file_name. After your app is published you can share it with others.
A video explaining how to publish your Shiny app can be found here.
The next two questions will use the Shiny app located at: https://yhejazi.shinyapps.io/tutorial/
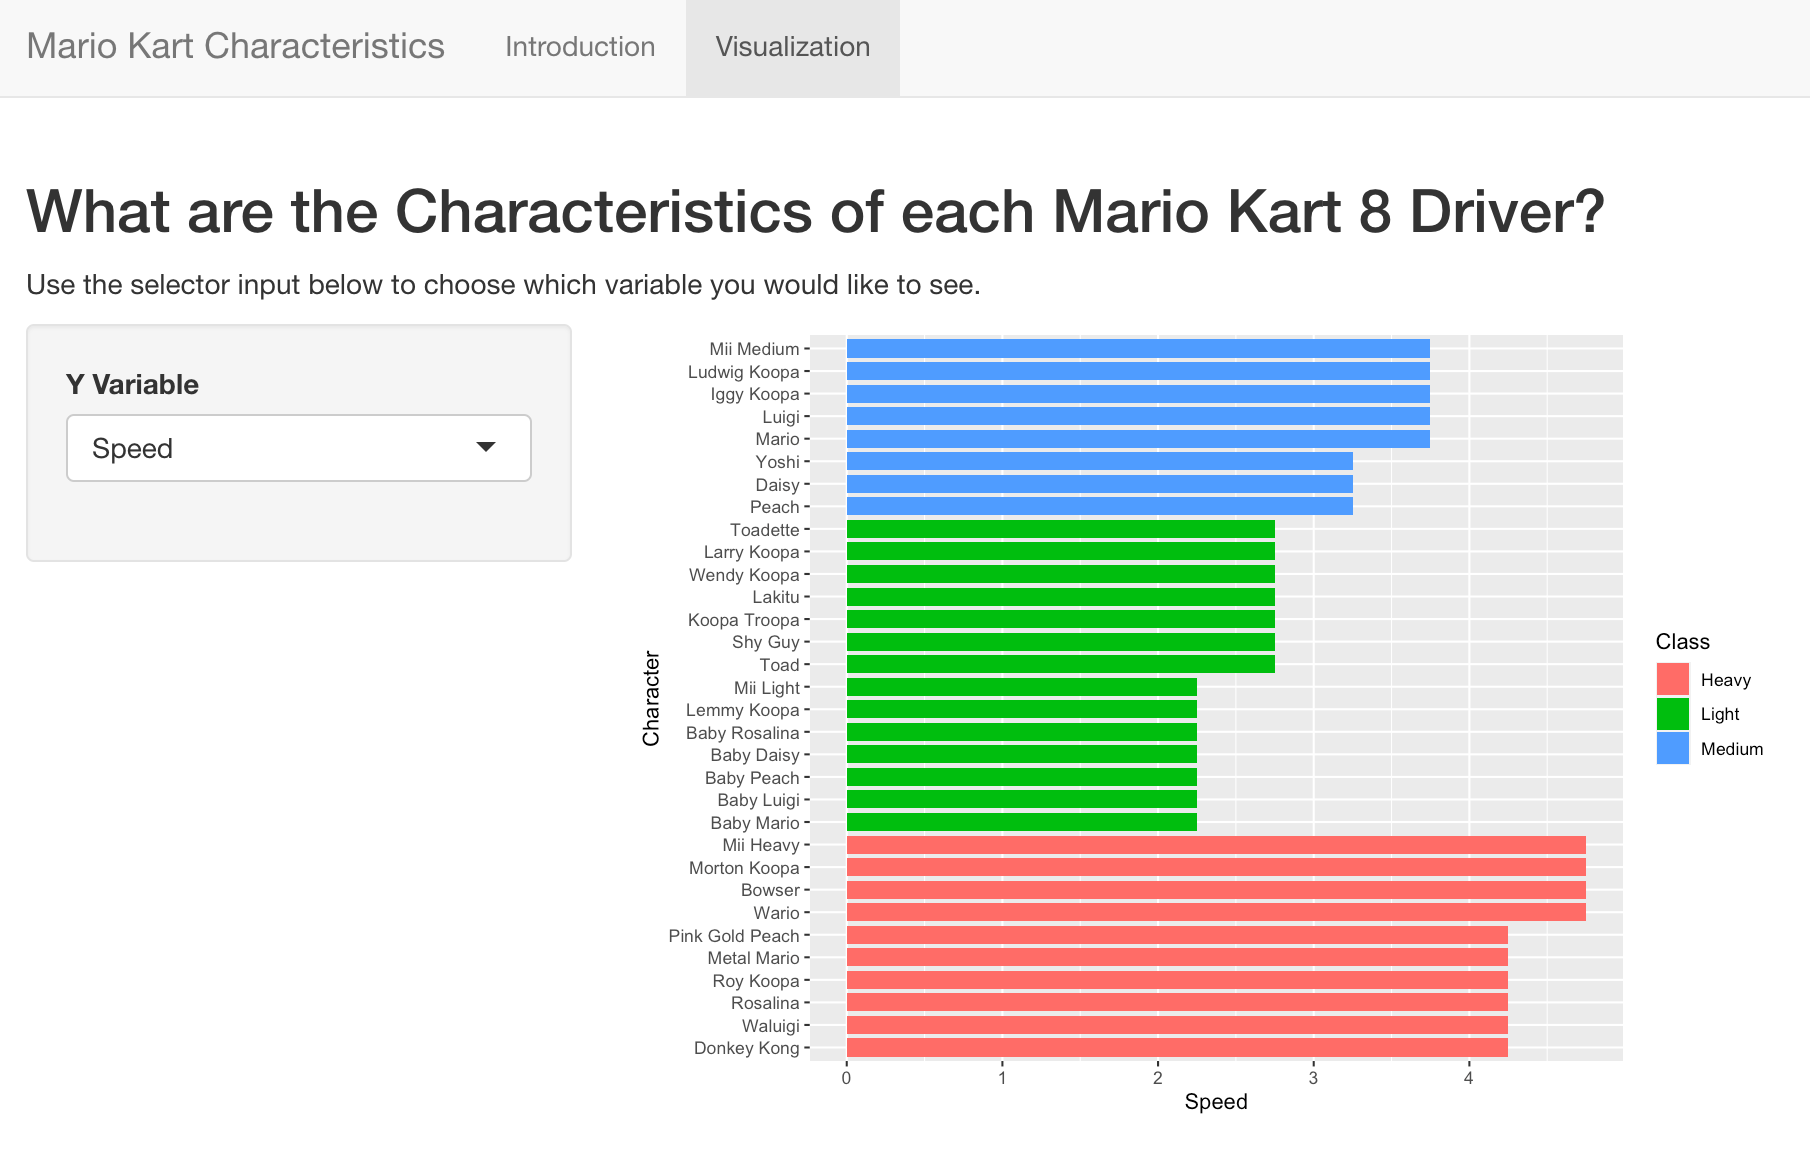
Image of one page of the Shiny App, from Yasmine Hejazi
110.7 Common Mistakes & Errors
One of the tough parts about Shiny apps is that after you compile the code into the app, there can still be errors which appear, but only after you test different combinations in your app. For example, if your app has a dropdown menu to filter options, there may be errors that occur for certain choices that you won’t see until the app has been made. The best way to test for errors in Shiny apps is to test out different combinations in your app once it has been made.
Here are some common issues that occur when making Shiny apps.
Plots or Tables not Showing up
If you have a plot/table not showing up, one of the first things you should do is make sure that your
output$keywordin the server section matches yourkeyworddefined in the ui section. If you place a keyword which does not exist in the server section, R will not create any plots for that keyword. To fix this, check to make sure your keyword exists and matches the one defined in the ui section.This error can also occur if you try to reference an input which does not exist. Again, the fix for this is to make sure the keyword you are using exists and matches the one defined in
ui.
Problem with filter() input ..1
- Errors like this will usually occur in the spot where your table or plot will be located. These errors are not exclusive to the
filterfunction but can appear for any function. When these errors occur, it is usually because the function is being used incorrectly. For example, trying to filter data from a variable that doesn’t exist or using aggplotargument which does not make sense.
Some other common issues which can occur include:
- Missing/extra commas or brackets when defining different inputs on the
uisection.- Usually shown by “argument is missing, with no default.”
- Not using the proper
renderfunction to display your data. For example, usingrenderPlotwhen trying to display a table.- If you try to
ggplotwithrenderTableyou will get a “cannot coerce class ‘c(“gg,” “ggplot”)’ to a data.frame” error. - If you try to display a table with
renderPlotyou will an error saying “invalid quartz() device size.”
- If you try to
A helpful link for debugging any issues that occur when making Shiny apps is https://shiny.rstudio.com/articles/debugging.html. This website goes through things like debugging and finding where your errors are happening.
110.8 Next Steps
Some helpful links for creating Shiny apps include:
The Shiny website. This includes both written and video tutorials on creating Shiny apps. https://shiny.rstudio.com/tutorial/
Mastering Shiny by Hadley Wickham. Similar to the Shiny website this online book teaches readers how to create Shiny apps and also shows the code used to create these apps. https://mastering-shiny.org/index.html
The Shiny cheat sheet created by R. https://shiny.rstudio.com/images/shiny-cheatsheet.pdf
110.9 Questions
- What are Shiny apps?
- Apps that are shiny
- Interactive apps made using RStudio
- Interactive apps made using python
- Knitted R markdown files
- True or False, Shiny apps can include content such as quizzes?
- True
- False
- What does the
uisection do on a Shiny app?
- The
uisection creates plots for your app - The
uisection will control what the person using your Shiny app will not see - The
uisection will control what the person using your Shiny app will see - The
uisection does not do anything
- What does the
serversection do on a Shiny app?
- The
uisection creates plots for your app - The
uisection will control what the person using your Shiny app will not see - The
uisection will control what the person using your Shiny app will see - The
uisection does not do anything
- If I want to add a table to my Shiny app, which function should I use?
renderTextrenderObjectrenderPlotrenderTable
- True or False, you need to pay to publish a Shiny app?
- True
- False
- Which file type should I select to create a Shiny app?
- “R Script”
- “R Markdown”
- “Text File”
- “Shiny Web App”
- How should input keywords be referred to in the
serversection?
- output$keyword
- input$keyword
- input.keyword
- input-keyword
- What should we save our output files as in the
serversection?
- output$keyword
- input$keyword
- output.keyword
- output-keyword
- What causes the “Problem with
filter()input..1” error?
- The function was not loaded
- The dataset does not exist
- The function was used incorrectly
- None of the above